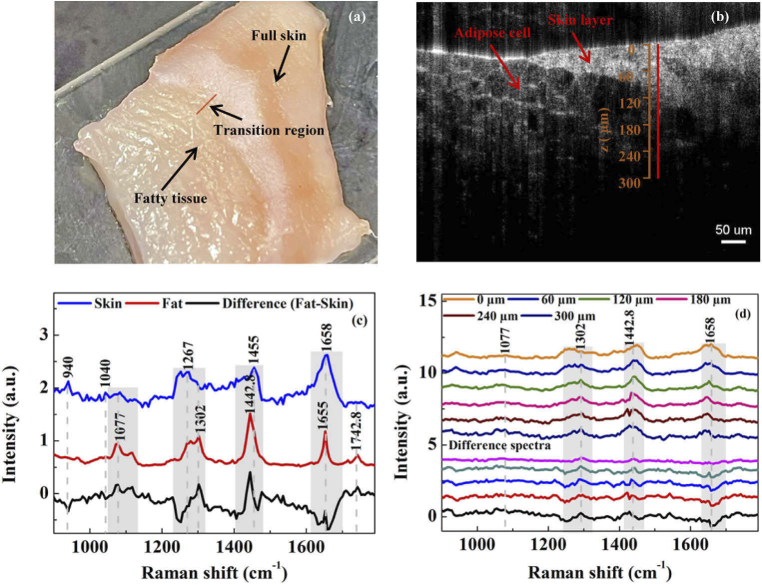
Fig. 5.
(a) Photo of a diagonally cut swine tissue. (b) OCT image of the pork tissue. (c) Reference Raman spectra of skin layer, fatty tissue, and difference between skin and fat spectra in the pork tissue. (d) Depth dependent Raman spectra of the pork tissue measured along the red line in (c) with the guidance of the OCT image and the difference between the spectra at depths from 60 µm to 300 µm and that at a depth of 0 µm.

