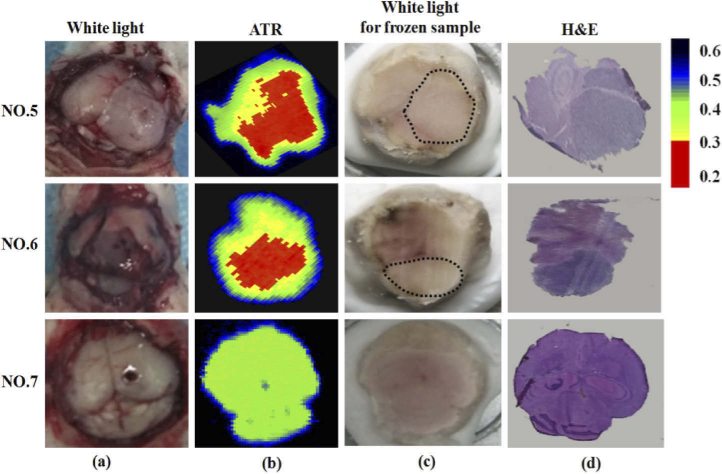
Fig. 6.
(a) In vivo visual image, (b) THz wave total reflection image, (c) freezing visual image, and (d) H&E-stained image for NO. 5-7 samples, the blue areas were the edge between sample and background. The red, green and black areas of (b) were the tumor tissue, normal tissue and background regions, respectively.

