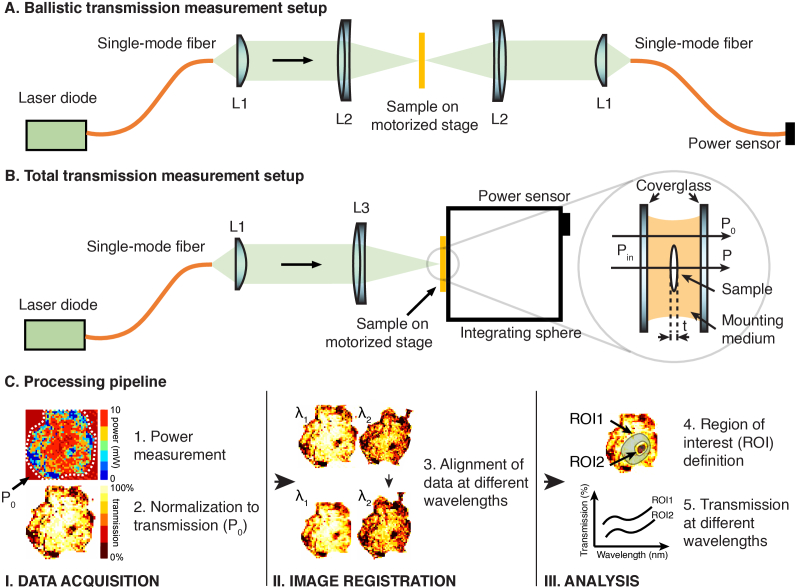
Fig. 1.
Schematics of the transmission measurement setup and processing pipeline. (A) Setup for ballistic transmission measurements. (B) Setup for total transmission measurements. (Inset) Illustration of the power measurements through a mounted sample (C) Processing pipeline after transmission measurements. The location to obtain Po is illustrated in the left panel in (C).

