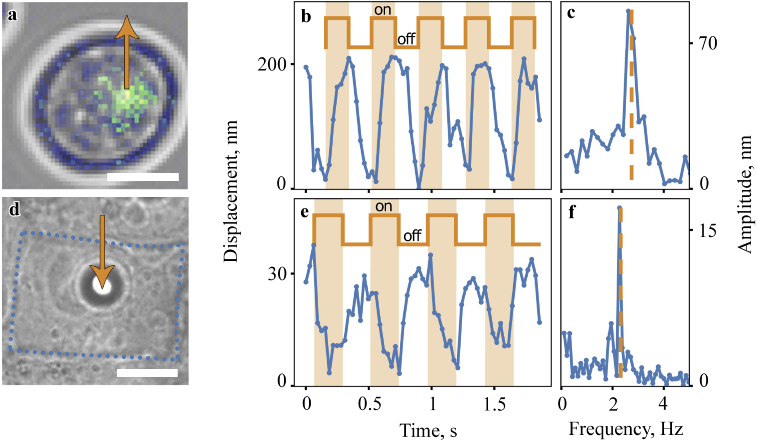
Fig. 4.
Yeast cell and cancer cell dynamics. (a) Scattering intensity map is placed on top of the microscope image of the yeast cell revealing the nucleus location. (b) Yeast cell organelle oscillation and (c) oscillation amplitude. (d) Microscope image of the cancer cell, dotted line indicates cancer cell boundaries, microsphere diameter is 5 µm. (e) Cancer cell oscillation and (f) oscillation amplitude. Blue curves depict cell oscillations, the periods of turning on and off the OT beam are indicated by orange color and meander. Orange arrow depicts trap position and trapping force direction. Scale bars: 5 µm (a) and 10 µm (d).

