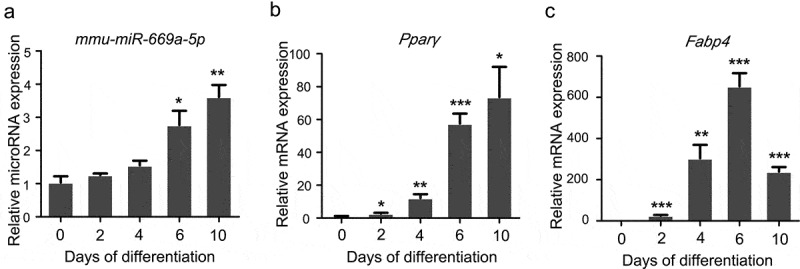
Figure 2.

miR-669a-5p is increased during differentiation of 3T3-L1 cells. (a)RT-qPCR to analyse the expression of miR-669a-5p in 3T3-L1 cells during differentiation, normalized to U6 expression. n = 3 per group.(b and c) RT-qPCR to analyse the mRNA expression levels of adipogenesis markers Pparγ and Fabp4 in 3T3-L1 cells during differentiation, normalized to β-actin expression. n = 3 per group.Data are representative of at least three individual experiments. Results are represented as mean ± SEM. *p < 0.05, **p < 0.01, ***p < 0.001 versus day 0 group.
