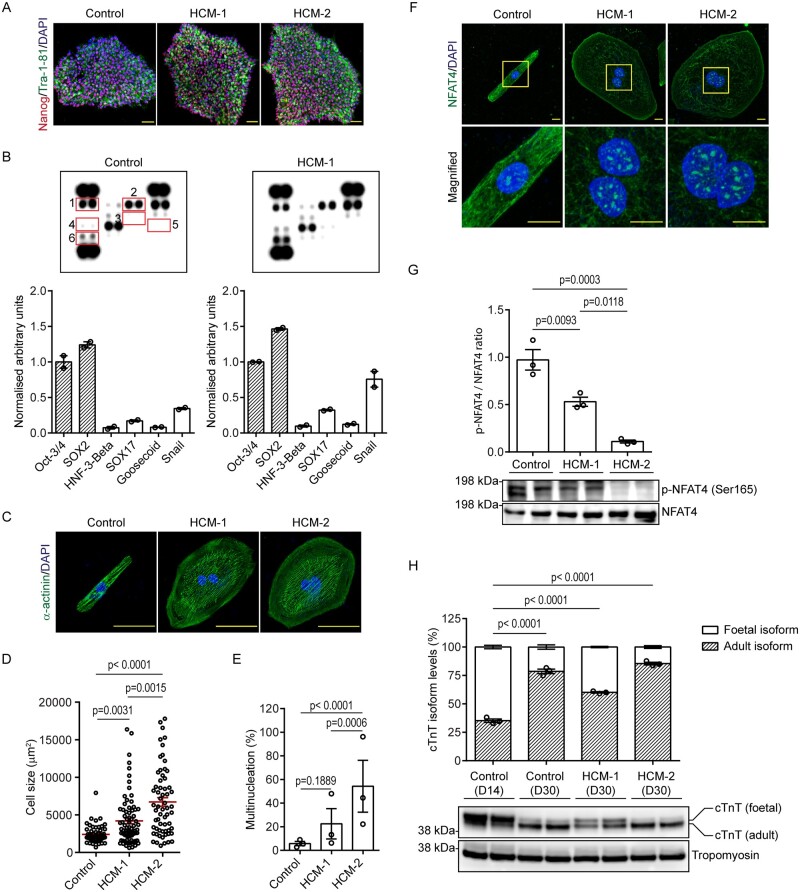
Figure 1.
Morphological characterization of HCM-CMs. (A) Representative immunofluorescence pictographs of control- and HCM-iPSCs stained against pluripotency antigens; Nanog (red) and Tra-1-81 (green), and counterstained with DAPI (blue). Scale bar: 50 µm. (B) Proteome profiler array showing expression of pluripotent (shaded bars) and non-pluripotent markers (clear bars) in control and HCM-1 iPSCs with graphs presented as mean ± S.E.M. showing densitometry data normalized to internal control. Numbers: Oct-3/4 (1), SOX2 (2), HNF-3-Beta (3), SOX17 (4), Goosecoid (5), and Snail (6). (C) Representative immunofluorescence pictographs of control- and HCM-CMs stained against sarcomeric α-actinin (green) and counterstained with DAPI (blue). Scale bar: 50 µm. (D) Graph presented as mean ± S.E.M. showing comparisons in cell size between control- and HCM-CMs (Control n = 54; HCM-1 n = 76; HCM-2 n = 62; Kruskal–Wallis followed by Dunn’s post hoc test; three independent experiments). (E) Graph presented as mean ± S.E.M. showing percentage of multinucleated cells in control- and HCM-CMs (Control n = 70; HCM-1 n = 93; HCM-2 n = 83; one-way analysis of variance (ANOVA) followed by Tukey’s post hoc test; three independent experiments). (F) Representative immunofluorescence pictographs of control- and HCM-CMs stained against NFAT4 (green) and counterstained with DAPI (blue). Yellow inset represents magnified region. Scale bar: 10 µm. (G) Western blot showing phosphorylated NFAT4 levels in control- and HCM-CMs, with graphs presented as mean ± S.E.M. showing densitometry data normalized to total NFAT4 (n = 3 independent experiments; one-way ANOVA followed by Tukey’s post hoc test). (H) Western blot showing differential expression of cTnT isoforms between immature day 14 and mature day 30 iPSC-CMs, with graphs presented as mean ± S.E.M. (n = 3 independent experiments; one-way ANOVA followed by Tukey’s post hoc test).

