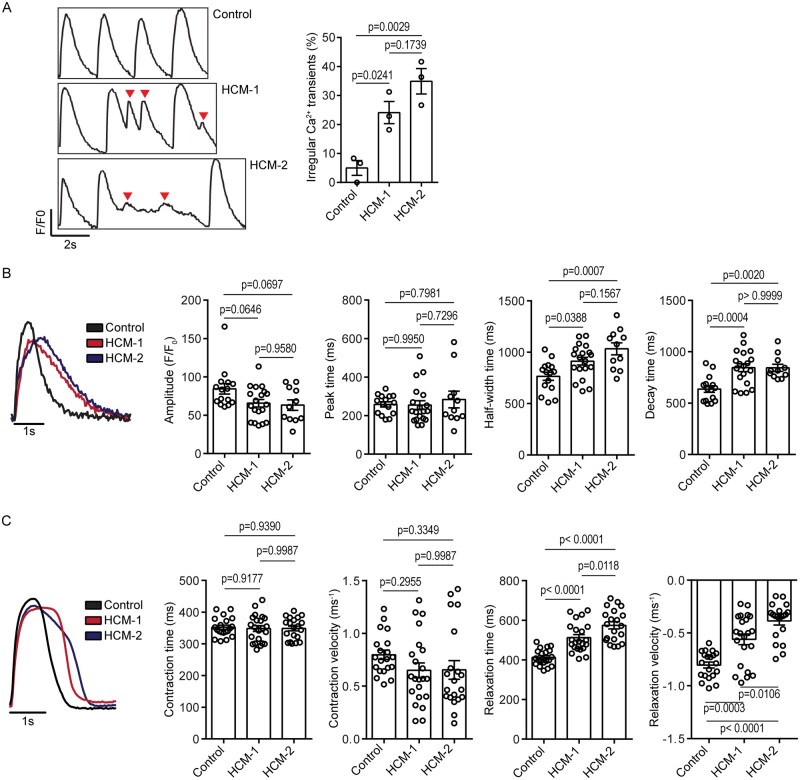
Figure 2.
Functional characterization of HCM-CMs. (A) Representative calcium transient trace indicating irregular calcium transients (red arrowheads) in HCM-CMs, with graph presented as mean ± S.E.M. showing percentage of cells with irregular calcium transients (Control n = 35; HCM-1 n = 59; HCM-2 n = 38; one-way ANOVA followed by Tukey’s post hoc test; three independent experiments). (B) Representative calcium transient trace indicating prolonged half-width and decay times in HCM-CMs, with graphs presented as mean ± S.E.M. showing comparisons in calcium transient amplitude, peak time, half-width, time and decay time between control- and HCM-CMs (Control n = 15; HCM-1 n = 19; HCM-2 n = 11; one-way ANOVA followed by Tukey’s post hoc test; three independent experiments). (C) Representative contractile trace indicating prolonged relaxation times in HCM-CMs, with graphs presented as mean ± S.E.M. showing comparison in contraction time, contraction velocity, relaxation time, and relaxation velocity between control- and HCM-CMs (Control n = 20; HCM-1 n = 22; HCM-2 n = 20; one-way ANOVA followed by Tukey’s post hoc test; three independent experiments).

