Figure 2.
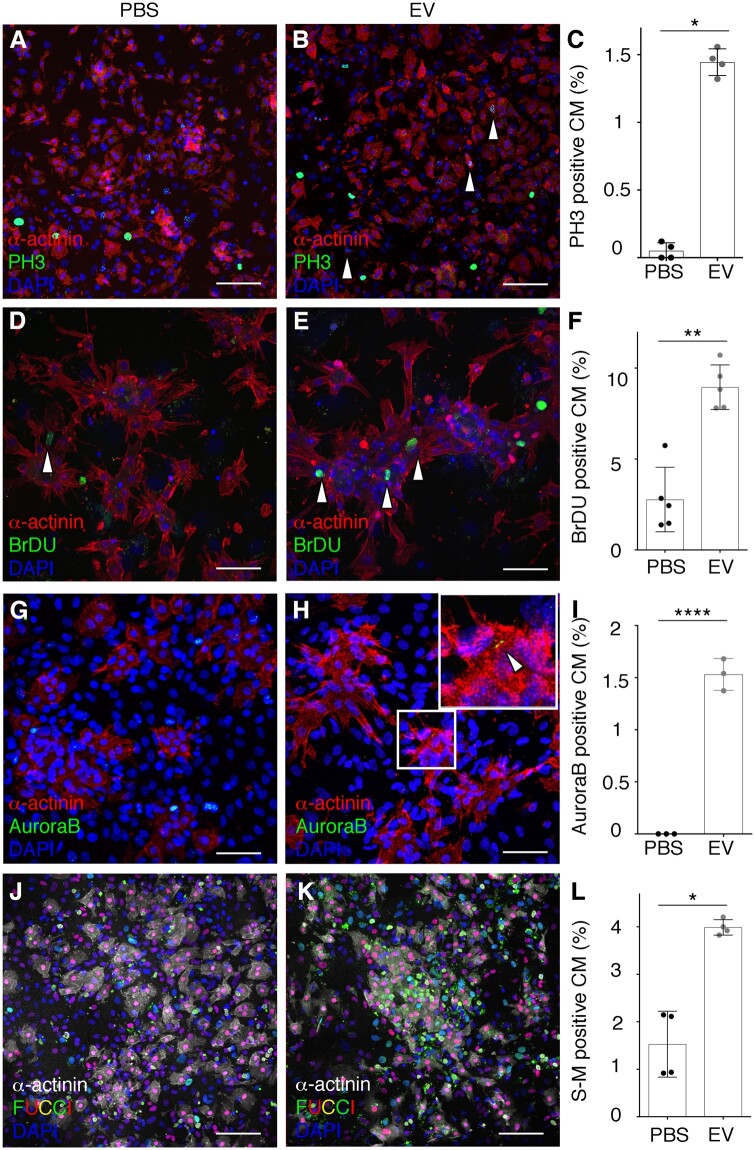
Epicardial EVs promote cell proliferation in mouse neonatal cardiomyocytes. (A, B) Immunostaining of PH3 (green) and α-actinin (red) of cultured mouse neonatal cardiomyocytes treated with vehicle (PBS) (A) or epicardial EVs (EV) (B). Arrowheads in (B) point to PH3 positive cardiomyocytes, co-stained for both markers. (C) Quantification of proportion of cardiomyocytes (α-actinin positive) positive for PH3 in both vehicle (PBS) and EV-treated cultures (EV). (D, E) Immunostaining for BrdU (green) and α-actinin (red) of cultured mouse neonatal cardiomyocytes, treated with vehicle (PBS) (D) or epicardial EVs (EV) (E). (F) Quantification of proportion of cardiomyocytes (α-actinin positive) positive for BrDU in both vehicle (PBS) and EV-treated cultures (EV). (G, H) Immunostaining for Aurora-B (green) to show cytokinesis and α-actinin (red) of cultured mouse neonatal cardiomyocytes, treated with vehicle (PBS) (G) or epicardial exosomes (Exo). (H) Magnification of boxed area and arrowhead in (H) point to a positive cytokinetic furrow between cardiomyocyte cells. Note only immunoreactivity during cytokinesis is considered as positive Aurora-B signal. (I) Quantification of proportion of cardiomyocytes (α-actinin positive) positive for PH3 in both vehicle (PBS) and EV-treated (EV) cultures. (J, K) Immunostaining α-actinin (grey) of cultured mouse neonatal cardiomyocytes from FUCCI line, in which endogenous Venus (green) fluorescence labels cells in S-M and Tomato, (red), cells in G1 phase of the cell cycle; treated with vehicle (PBS) (J) or epicardial EVs (EV) (K). (L) Quantification of proportion of cardiomyocytes (α-actinin positive) positive for Venus-FUCCI in both vehicle (PBS) and EV-treated (EV) cultures. DAPI (blue) labels cell nuclei. Data are presented as mean±SEM. n=4 PH3, Control; n=4 PH3, EVs; n=5 BrdU, Control; n=5 BrdU, EVs; n=3 Aurora-B, Control; n=5 Aurora-B, EVs; n=4 FUCCI, Control; n=4 FUCCI, EVs. *P<0.05, **P<0.01, ***P<0.001, ****P<0.0001. Mann–Whitney test. Scale bars: 50 µm.

