Figure 3.
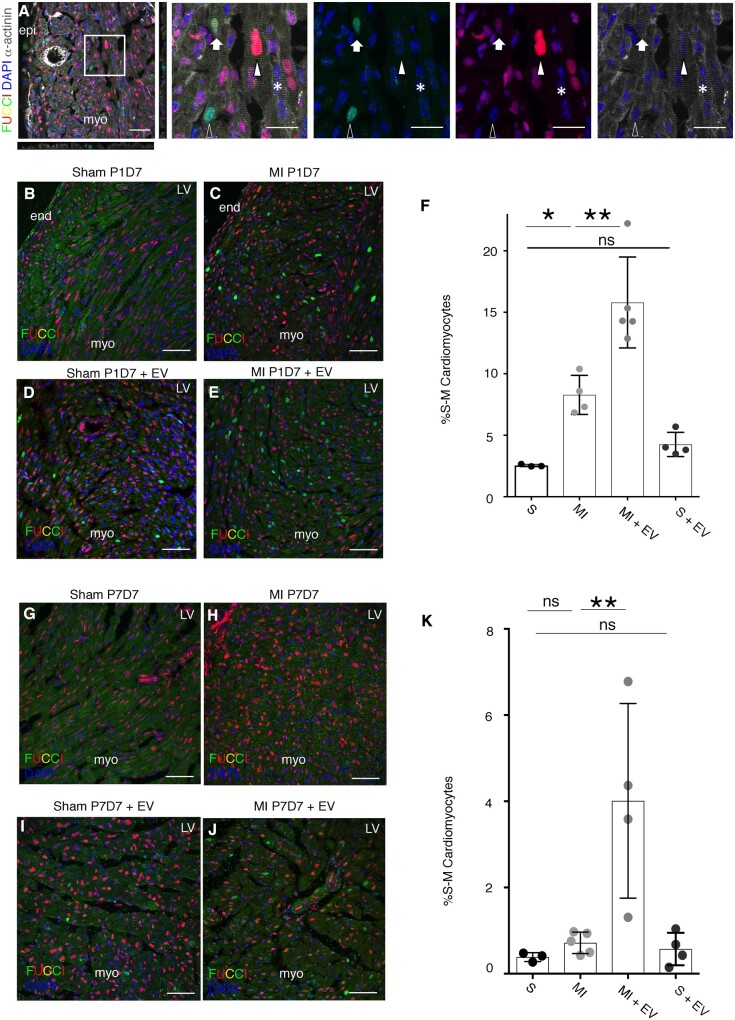
Epicardial EVs increase cardiomyocyte proliferation after injury in P1 and P7 hearts. (A) α-actinin (grey) and FUCCI reporter (green and red) detection in the neonatal heart. DAPI (blue) labels cell nuclei. Left panel shows merge of all the channels and includes orthogonal views to highlight detection of cardiomyocyte nuclei positive for the FUCCI reporters. Middle and right panels are separate channels from the magnified boxed area in the left panel. Empty arrowhead points to a Venus (green) positive cardiomyocyte. Filled arrowhead points to a tomato (red) positive cardiomyocyte. Filled arrow points to a cardiomyocyte displaying both FUCCI markers. Asterisk points to a cardiomyocyte that is not labelled for any of the FUCCI reporters. (B–E) FUCCI cell cycle reporter (red and green) and DAPI to label cell nuclei are shown in P8 heart sections collected 7 days after sham or MI procedure followed by epicardial EV or vehicle injection performed at P1. (B) Sham, (C) MI, (D) Sham with administration of EVs, (E) MI with administration of EVs. (F) Quantification of cardiomyocytes’ cell cycle reported by FUCCI expression at P8, 7 days after procedure at P1 (S: sham, MI: myocardial infarction, MI+ EV: myocardial infarction followed by EV injection, S+EV: Sham + EV injection). (G–J) FUCCI cell cycle reporter (red and green) and DAPI to label cell nuclei are shown in P14 heart sections collected 7 days after sham or MI procedure followed by exosome or vehicle injection performed at P7. (G) sham, (H) MI, (I) sham with administration of exosomes, (J) MI with administration of exosomes. (K) Quantification of cardiomyocytes’ cell cycle reported by FUCCI expression at P14, 7 days after procedure at P7 (S, sham; MI, myocardial infarction; MI+ EV, myocardial infarction followed by EV injection; S+EV, Sham + EV injection; LV, left ventricle; LA, left atria; RV, right ventricle; RA, right atria; epi, epicardium; myo, myocardium; end, endocardium). Data are presented as mean SEM. n=3 ShamP1D7; n=4 MI P1D7; n=5 MI+EVsP1D7; n=4, Sham+EVsP1D7; n=3 ShamP7D7; n=5 MI P7D7; n=4 MI+EVsP7D7; n=4, Sham+EVsP7D7. *P<0.05, **P<0.01, ***P<0.001. Mann–Whitney test. Scale bars: 50 µm except magnified panels in (A): 20 µm.

