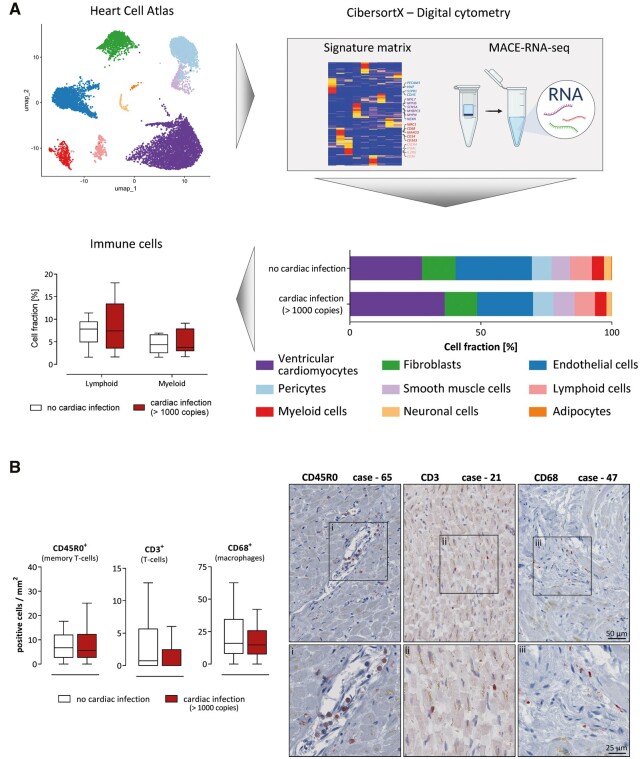
Figure 2.
Cardiac SARS-CoV-2 infection was not associated with increased immune cell infiltration. (A) The previously published ‘Heart Cell Atlas’14 served as single-cell RNA-sequencing dataset to generate a signature matrix using CibersortX from left ventricular tissue originated cells. Digital cytometry was performed, applying the generated signature matrix to our MACE-RNA-seq data by CibersortX. Cell fractions were estimated for each individual case. Comparing the immune cell fractions between cases with (n = 10) and without (n = 10) cardiac infection, no significant differences were determined using Mann–Whitney U test. Cell fractions are depicted as Tukey-style box plots with median and inter-quartile range without outliers. (B) The number of positively stained immune cells per mm2 is displayed. Cases without cardiac infections (n = 46) are depicted in white, whereas cases with cardiac infection (n = 41) are depicted in red. The patient groups were compared using Mann–Whitney U test revealing no significant differences. Data are depicted as Tukey-style box plots with median and inter-quartile range without outliers. Representative staining of immune cells in cardiac tissue is displayed. On the left panel, the CD45R0 staining for Case 65, quantified as 15.1 cells per mm2, is shown. The middle panel depicts the CD3 staining for Case 21 (7.4 cells/mm2). For Case 47, the CD68 staining is shown on the right panel (14.7 cells/mm2). Magnifications are displayed below for each case.

