Figure 3.
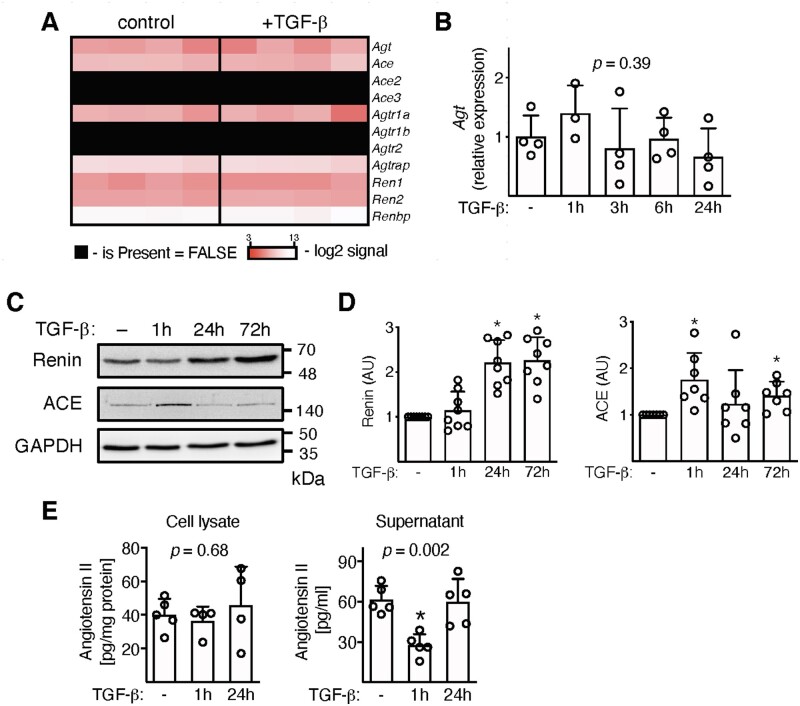
Inflammatory cells were isolated from hearts of wild-type mice at day 17–21 of EAM, expanded, and stimulated with TGF-β1 (10 ng/mL). Panel (A) shows expression of genes involved in Ang II synthesis in unstimulated cells and treated with TGF-β for 24 h (n = 4). A kinetic of angiotensinogen (Agt) expression is shown in panel (B) (n = 3–4). p value calculated with one-way ANOVA. Panel (C) shows immunoblots of enzymes involved in Ang II production. Quantifications of the respective protein levels (normalized to GAPDH) are presented in panel (D) (n = 7–8). *p < 0.05 (vs. control) calculated with Kruskal–Wallis followed by Dunn’s test. Levels of Ang II measured with mass spectroscopy in cell lysate (n = 4–5) and in supernatants (n = 5) are shown in panel (E). p values calculated with one-way ANOVA followed by multiple comparison using the Fisher’s LSD test. *p < 0.05 (post-hoc test).

