Figure 6.
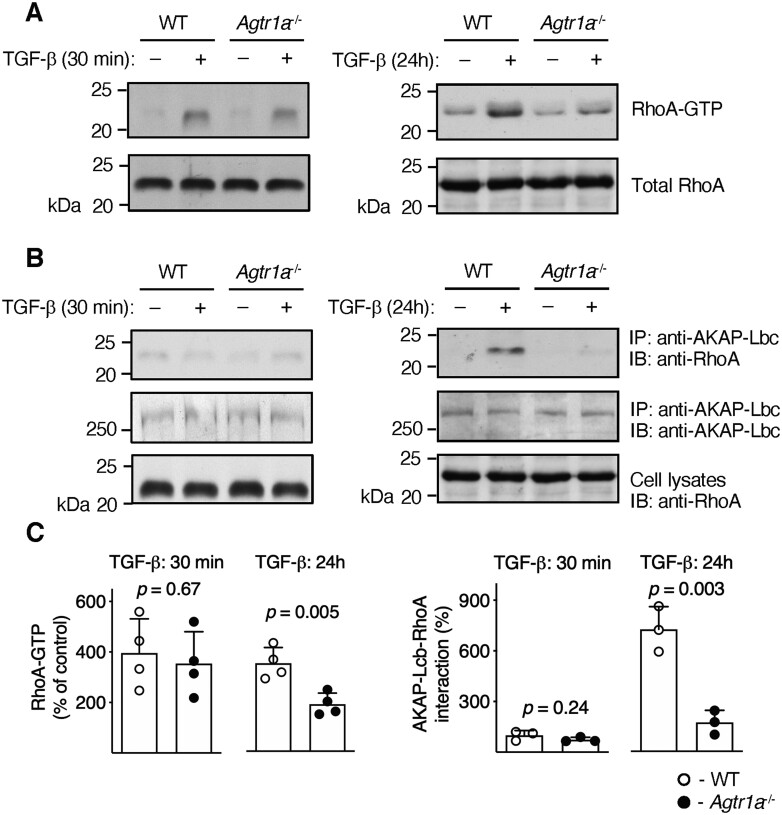
Inflammatory cells were isolated from hearts of wild-type (WT) and Agtr1a-/- mice at day 17–21 of EAM, expanded, and stimulated with TGF-β1 (10 ng/mL) for 30 min or 24 h. Panel (A) shows anti-RhoA immunoblots of purified GTP-bound Rho protein extracts (RhoA-GTP) and total cell lysates (total RhoA). Panel (B) shows anti-RhoA and anti-AKAP-Lbc immunoblots (IB) of immunoprecipitated (IP) protein extracts with anti-AKAP-Lbc antibodies. Anti-RhoA immunoblots of the whole cell extracts are presented in the bottom panel. Panel (C) shows quantifications of normalized RhoA-GTP levels (normalized to total RhoA, left, n = 4) and amount of RhoA immunoprecipitated with anti-AKAP-Lbc antibodies (normalized to IB AKAP-Lbc, right, n = 3). p values calculated with unpaired Student’s t-test.

