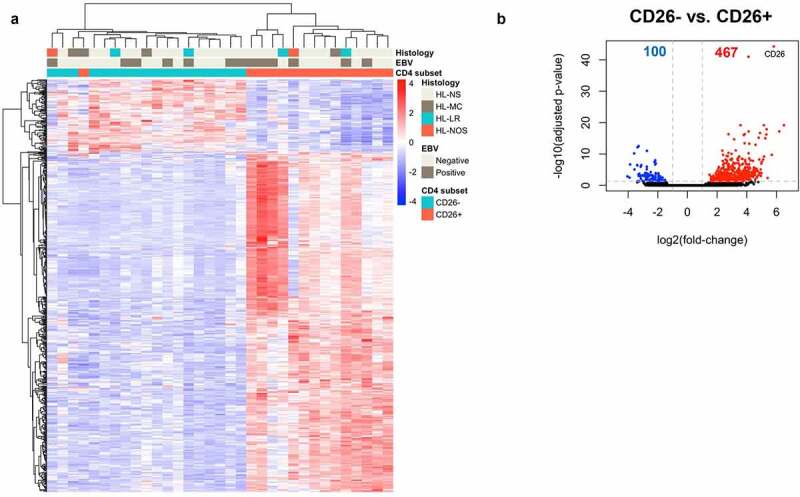
Figure 3.

Genes differentially expressed between CD26- and CD26+CD4+ T cells. (a) Heatmap showing the unsupervised hierarchical clustering of 567 genes differentially expressed between CD4+CD26- and CD4+CD26+ T cells. Of the 567 genes, 100 were upregulated and 467 downregulated in CD4+CD26- T cells. Rows are genes, columns are samples. (b) Volcano plot for CD4+CD26- versus CD4+CD26+ . – log10(adjusted p-values) are plotted against log2(foldchange). Grey dashed lines indicate an adjusted p-value of <0.05 and a log2(foldchange) greater than 1 in both directions. NS = Nodular Sclerosis; MC = Mixed Cellularity; LR = Lymphocyte Rich; NOS = Not Otherwise Specified.
