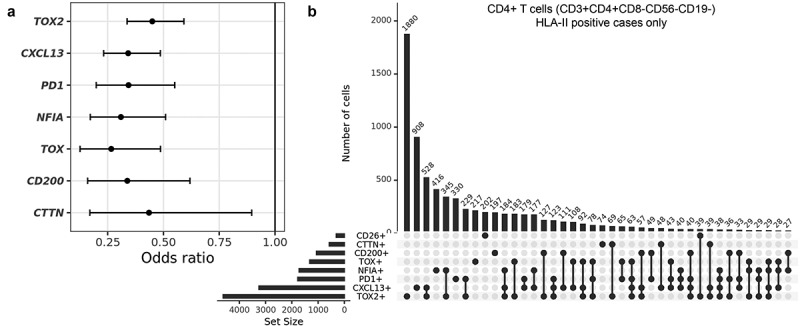
Figure 4.

Characterization of co-expression patterns in CD4+ T cells using single-cell RNA-seq data from HLA class II positive cHL cases. (a) Odds ratio (OR) of expression of the selected genes in CD4+CD26+ versus CD4+CD26- T cells. Indicated are the OR with 95% confidence intervals. (b) UpSet plot showing co-expression patterns of CD26 with the seven selected genes in single CD4+ T cells. A total of 13014 cells was evaluated.
