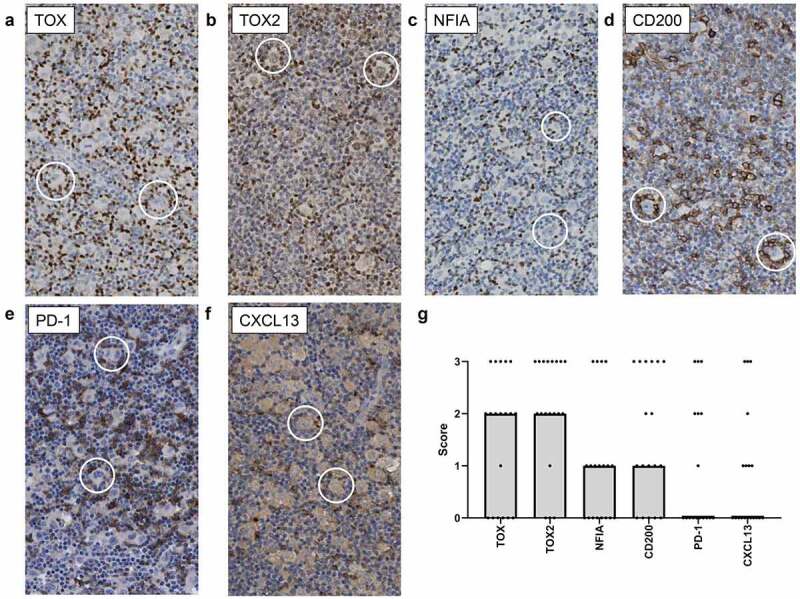
Figure 5.

Representative images of immunohistochemical staining in cHL tissue to define rosette specific expression pattern. Representative images of (a) TOX, (b) TOX2, (c) NFIA, (d) CD200, (e) PD-1 and (f) CXCL13 staining. In each picture two rosettes (HRS cell with surrounding lymphocytes) are highlighted with a circle. (g) Visualization of the immunohistochemistry scores per marker. Points represent the scores of each of the 19 cHL cases used for sorting and subsequent bulk RNA-seq analysis. The bars represent the median score of all cases.
