Figure 3.

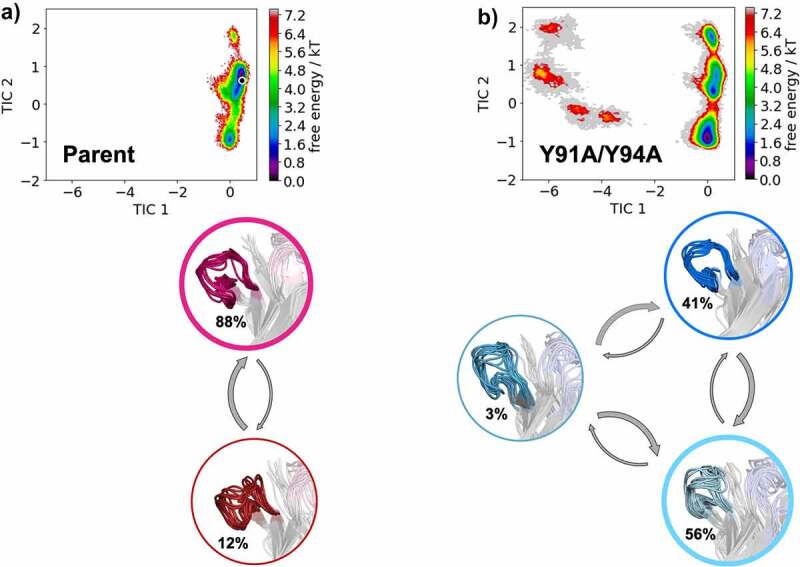
Free energy landscape of the CDR-H3 loop for both the Parent (a) and the double mutant L-Y91A/Y94A (b) presented in a kinetic coordinate system (tICA space). Based on the tICA, we calculated a Markov-state model, which allows us to reconstruct thermodynamics and kinetics of conformational CDR-H3 loop transitions. The crystal structure is projected in the tICA space for the parent and illustrated as white dot. The thickness of the circles corresponds to the state probabilities. The transition timescales between different CDR-H3 loop conformations occur in the low microsecond timescale. Free energy landscapes and representative ensemble structures of the CDR-H3 loop for the Parent and the bispecific yield reducing double mutant show a population shift away from the dominant binding competent CDR-H3 loop conformation in solution resulting from two-point mutations in the CDR-L3 loop.
