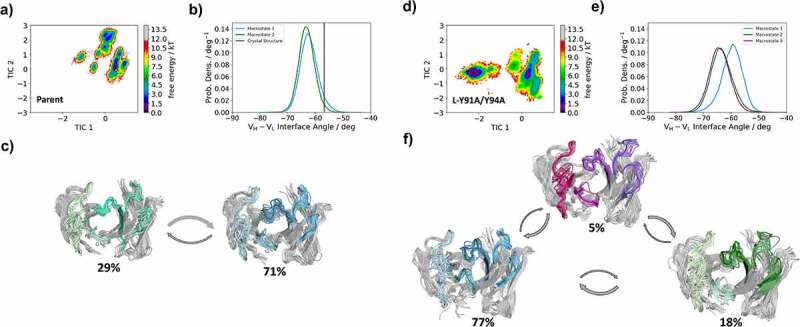
Figure 5.

Free energy landscape of all antibody CDR loops for both the Parent and the double mutant L-Y91A/Y94A anti-MET Fab showing the Markov-state model, the respective macrostate ensembles and the and interdomain angle distributions (HL torsion angle). The macrostate ensembles (c and f) are arranged according to the shape of the tICA free energy surface (a and d). The macrostate ensembles depict the light chain on the left in lighter colors, while the heavy chain is shown on the right in darker colors. (b and e) VH-VL interdomain angle distributions (HL torsion angle) have been calculated with ABangle and color-coded according to the respective macrostates. The available crystal structure is projected into the free energy surface (displayed as white dot) and into the interdomain angle distribution (illustrated as vertical line). Free energy surfaces and the representative ensemble structures of all CDR loops for the Parent show no shift in the interdomain orientation as a consequence of conformational rearrangements of the CDR loops. However, we observe that the yield reducing double mutant results in conformational rearrangements of all CDR loops, compared to the Parent and leads to a substantial shift in the relative interdomain orientation toward a smaller VH-VL interface angle.
