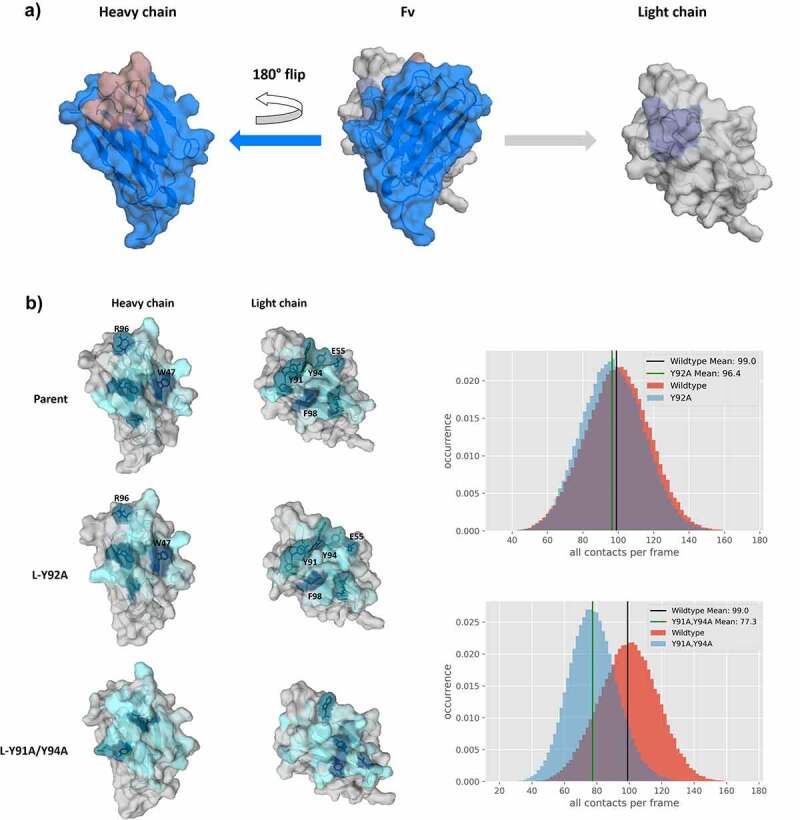
Figure 6.

“Open-book” representation of the VH and VL interfaces, color-coded according to the number of interdomain contacts per frame. a) illustrates the orientation of the domains, highlighting CDR-L3 and CDR-H3 loops, respectively. b) Comparison of interdomain interaction patterns between the Parent, the bispecific yield increasing L-Y92A mutant and the L-Y91A/Y94A double mutant. To have a more quantitative representation of the difference in interdomain contacts, we provide distributions showing the interdomain contacts per frame. The color-gradient (gray to blue) corresponds to the number of interdomain interactions each residue is forming (the higher the number of contacts, the darker are the shades of blue). Comparison of the “open-book” representation of the VH-VL interfaces shows clear reduction in the interdomain interactions for the yield reducing double mutant compared to the Parent, while another variant, which results in an increase of bispecific yield, reveals nearly identical interface patterns compared to the Parent.
