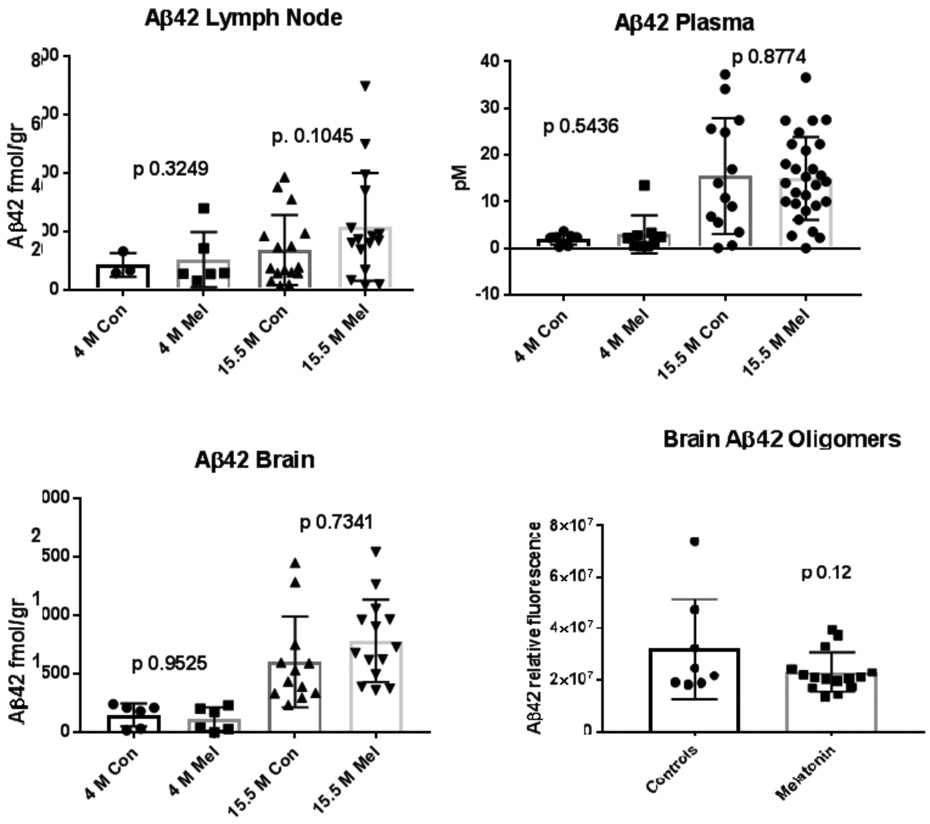
FIGURE 2.
Saline soluble monomeric Aβ42 in control and melatonin treated mice. Brain and lymph node homogenates in saline along with plasma (B) from Tg2576 mice were evaluated by a sensitive and specific ELISA assay as shown for figure 1. The n values for control (Con) and melatonin (Mel)-treated samples from 4 and 15.5 month-old animals are listed in order for lymph node (n=3, 6, 16, 16); plasma (n=3, 5, 14, 28) and brain (n=3, 2, 13, 14). Aβ40 oligomers measurements in brain at 15.5 age months are also shown in controls and after treatment with melatonin (n= 8; 15). As shown in figure 1, Aβ42 oligomers measurements in brain are shown at 15.5 age months in controls and after treatment with melatonin (n=8; 15). Con = Control mice. Mel = Melatonin treated mice. As mentioned for figure 1, acceptable and consistent Aβ42 oligomer standards are not available to establish curves; thus, we have compared the relative luminescence values detected in brain extracts from control and melatonin-treated mice. As with Aβ40, oligomeric Aβ42 was not detectable in plasma or in lymph nodes.

