FIGURE 2.
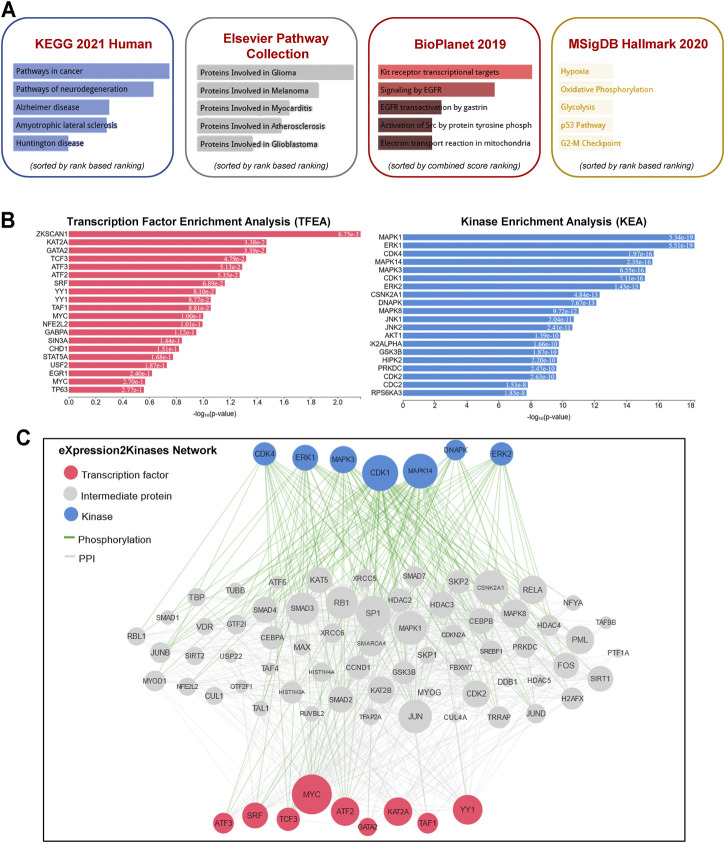
Pathway enrichment analysis and eXpression2Kinases network. (A) A comprehensive gene set enrichment analysis for the cis- and trans-regulatory target genes of differentially expressed lncRNAs was performed using EnrichR 2021 and the 2021 Kyoto Encyclopedia of Genes and Genomes (KEGG) Human database, Elsevier Pathway Collection, BioPlanet 2019, and the Molecular Signatures Database 2020 (MsigDB). (B) Transcription factor enrichment analysis (left panel) and kinase enrichment (right panel) analyses are shown for all the cis- and trans-regulatory target genes of differentially expressed lncRNAs. (C) The eXpression2Kinases (X2K) network displays the inferred upstream regulatory network predicted to regulate the input list of genes by integrating the results from the TFEA, the network expansion, and the kinase enrichment. Pink nodes represent the top transcription factors predicted to regulate the expression of the input gene list; blue nodes represent the top predicted protein kinases known to phosphorylate the proteins within the expanded subnetwork. Green network edges/links represent kinase-substrate phosphorylation interactions between kinases and their substrates, while grey network edges represent physical protein-protein interactions.

