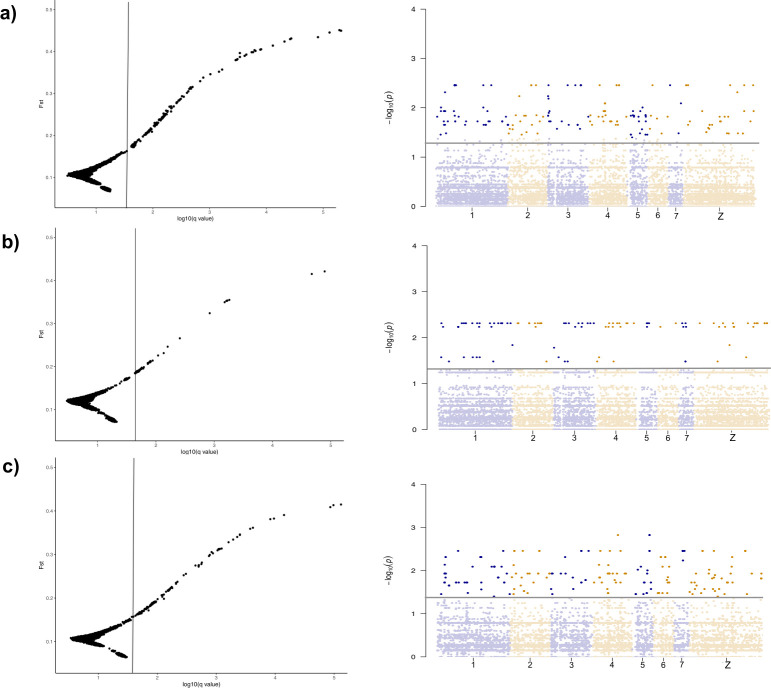
Fig 4. Plot of Fst outliers and genome scan of all identified loci that match to the indexed S. mansoni genome.
On the left Fst values obtained from BAYESCAN, each plot figure represents outliers in each simulated comparison: A) S. haematobium x S. bovis, B) S. haematobium x S. guineensis, C) S. guineensis x S. bovis. Loci that fall to the right of the vertical line have a probability greater than 50% of being designated outlier loci. Genome scan plots on the right show genomic location of outlier loci across the genome.

