Fig 1. Average Good’s coverage estimates (%) of each plant compartment.
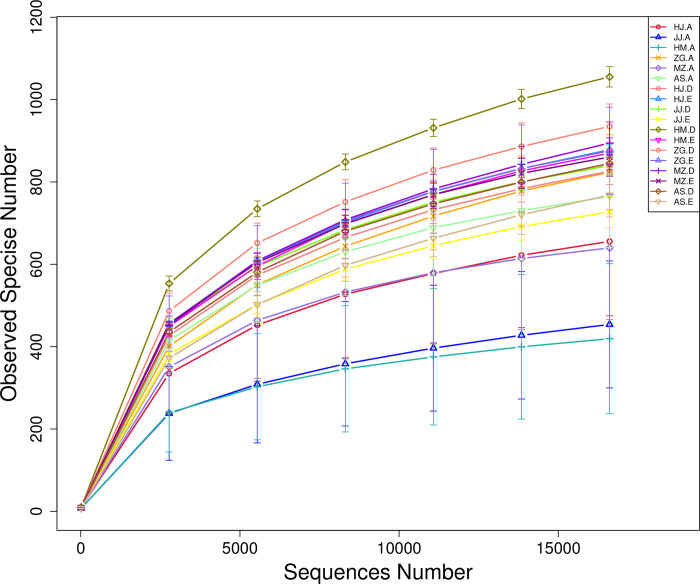
Rarefaction curves were assembled showing the number of OTUs, defined at the 97% sequence similarity cut-off in mothur, relative to the number of total sequences (The code in the figure is shown in Table 1).

