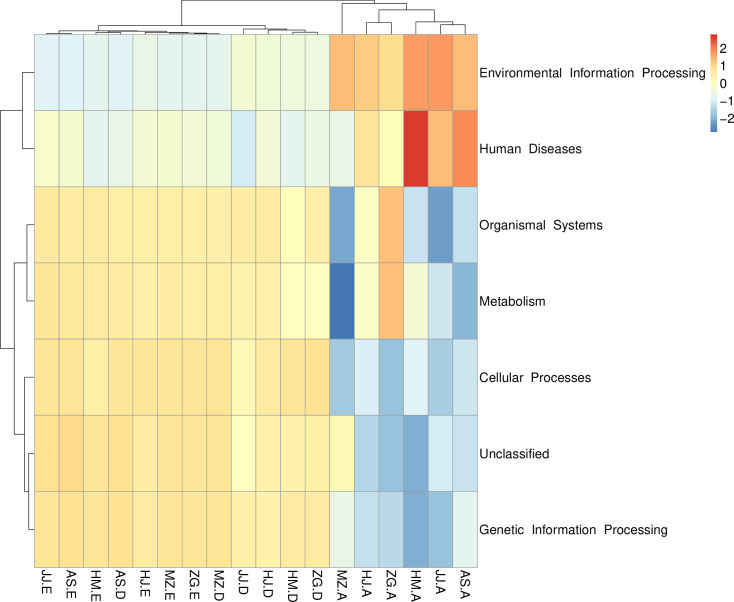
Fig 6. PICRUSt analysis of the bacterial microbiome in each plant compartment.
The top 35 the bacterial microbiome and their abundance information in each sample were mapped and clustered from the functional difference level (The code in the figure is shown in Table 1).

