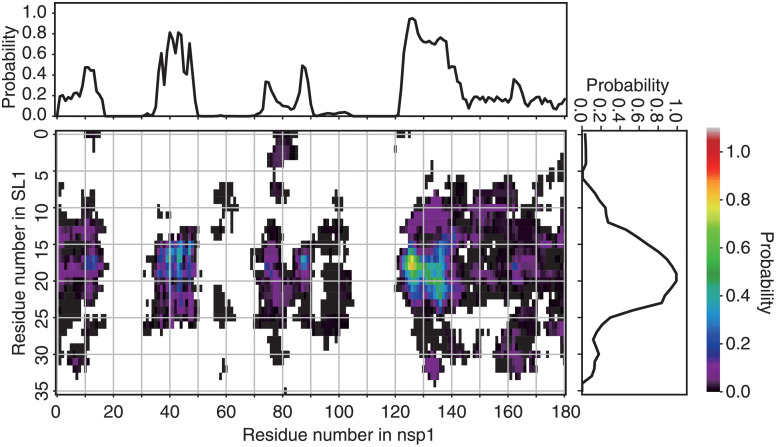
Fig 3. Contact probabilities between nsp1 and RNA.
Residue-wise, all-against-all contact probability in the canonical ensemble. The color at each grid point indicates the statistical weight of the contact between the corresponding pair of residues (color scale is shown at the right of the panel). The points filled by white indicate no detectable probability of contacts. The line plots at the top and right of the contact map depict the contact probability for each residue, regardless of its counterpart.

