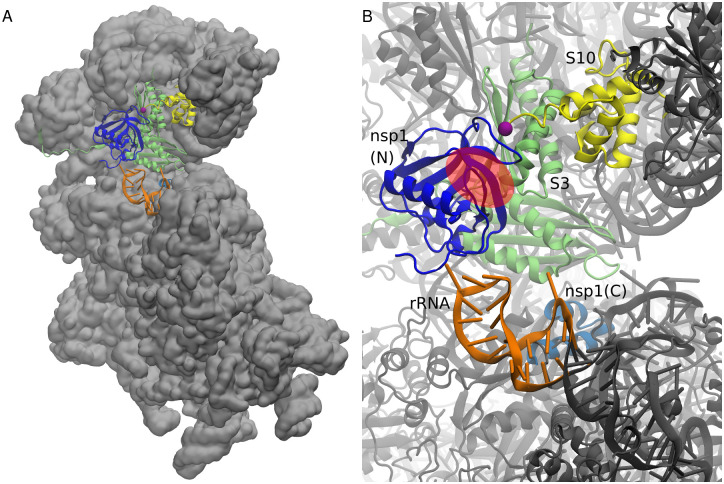
Fig 8. Mapping of the binding surface over the nsp1–40S ribosome complex.
(A) Overview of the nsp1–40S ribosome complex structure modeled from cryo-EM structure and its electron density map combined with the cross-linking mass spectrometry. (B) Close-up view of the structures around nsp1. The N-terminal and C-terminal parts of nsp1 are colored blue and cyan. A hairpin of rRNA (residue number 531 to 550) is colored orange, and the ribosomal proteins S3 and S10 are colored yellow and lime green, respectively. C-terminal region of S10 after residue 97 (purple sphere) is considered to be the disordered region and is not visible in the structure. Region corresponding to the “valley” of nsp1 binding surface is presented as a red transparent circle.

