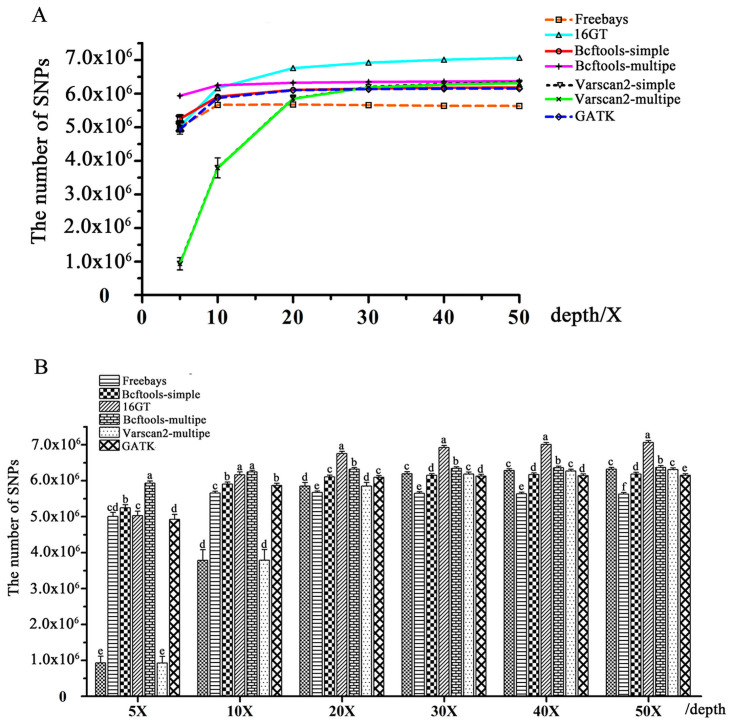
Fig 1. Comparisons of the total number of SNPs called out by seven different SNP calling pipelines.
A: Comparisons of the number of SNPs called out by different calling pipelines at each input read depth level. For each input level, the same letters indicate that the difference is not significant (P > 0.05), and the different letters indicate significant differences (P < = 0.05). B: The tendency of the number of SNPs called out by each pipeline with increasing input level.

