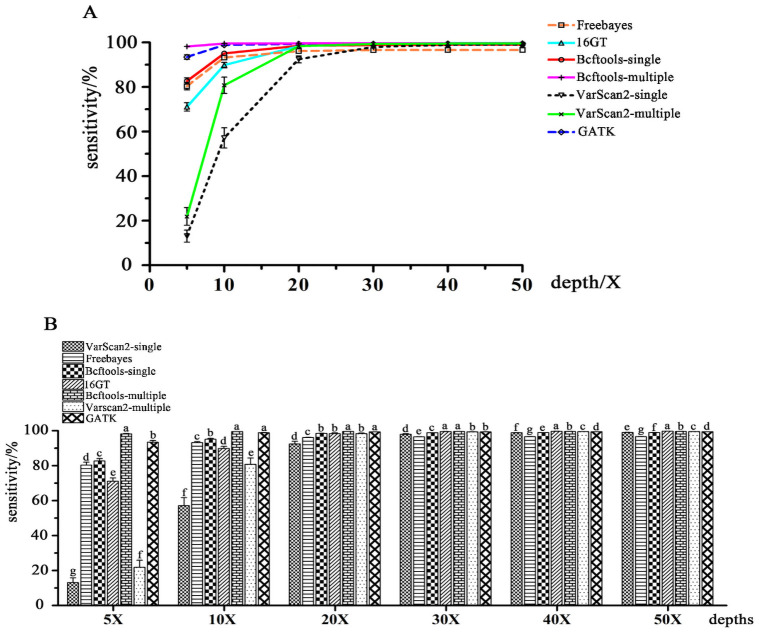
Fig 2. The sensitivities of seven SNP calling pipelines.
A: The sensitivity tendencies of each SNP calling pipeline with the input level increasing; B: Comparisons of the sensitivities of different calling pipelines at each input read depth level. For each input level, the same letters indicate that the difference is not significant (P > 0.05), and different letters indicate significant differences (P < = 0.05).

