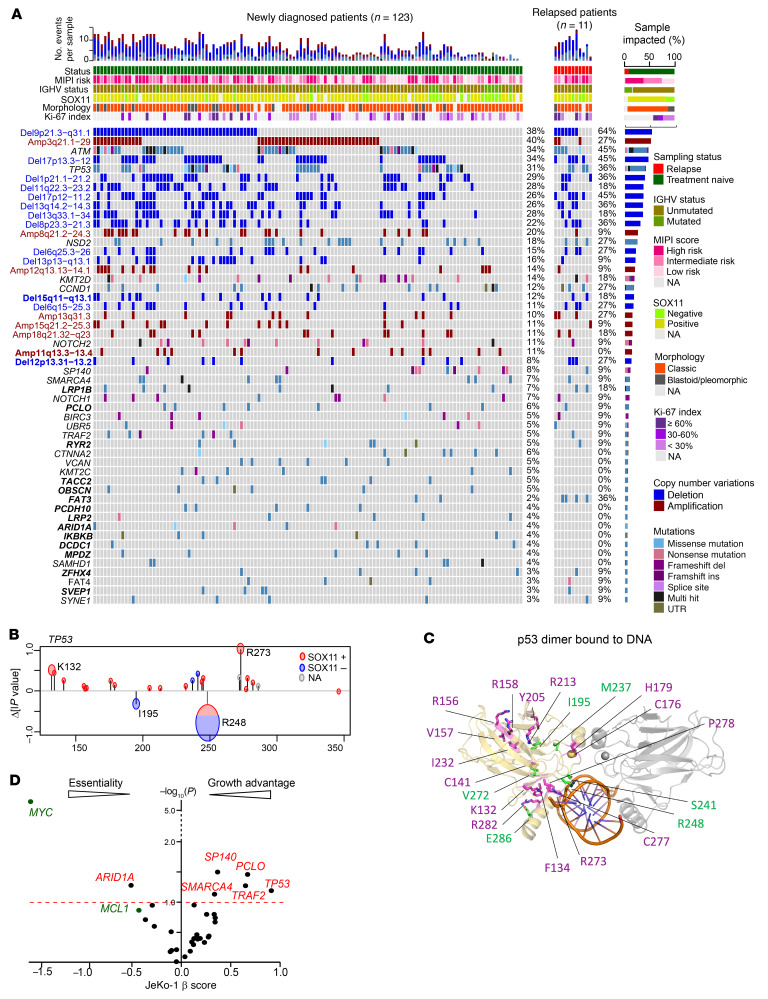
Figure 1. Recurrent somatic genetic alterations and mutation signatures in MCL.
(A) Recurrent somatic mutations and CN alterations (rows) identified following WES of 134 primary samples (columns) obtained from patients with newly diagnosed (green) and relapsed (red) MCL. Samples were annotated for prior treatment, MIPI risk, IGHV status, and Sox11 expression level when collected. Left: blue labels, recurrent CN deletion; red labels, recurrent CN amplification; black labels, somatic mutations; bold labels, novel CN alterations/mutations. Right: percentage of samples mutated. Top: total number of genetic alterations across the cohort. (B) Contributions of individual mutations to the collective WAP score of TP53. The changes in WAP score P value due to removal of individual mutations are plotted as function of residue number. The radius of the circles around each point in the graphs represent the number of patients with that mutation. Color indicates SOX11 expression. (C) TP53 dimer bound to DNA fragment, PDB ID: 3IGK. One of the monomers is shown in yellow, the other in gray. DNA is shown in orange. The mutations observed in SOX11+ and SOX11– patients are shown as magenta and green, respectively. (D) β Scores from genome-wide CRISPR/Cas9 screens of JeKo-1 of genes identified as having recurrent mutations.

