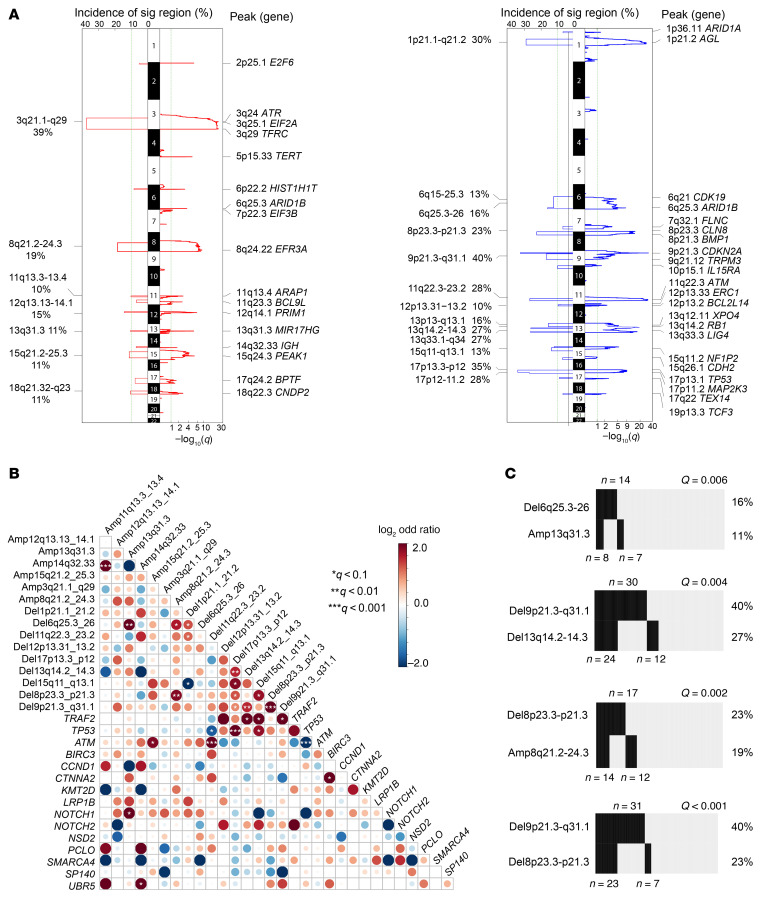
Figure 2. Recurrent SCNAs, cooccurring genetic events, and clinical association.
(A) Significant CN amplifications (left, red) and deletions (right, blue). Left sides of the mirror plots show the incidence of significant focal CNA events. Right sides of the mirror plots show q values for each region. Genes located in the peak of relevant cytobands are listed. (B) Pairwise associations between recurrent genetic alterations found in the 134 MCL samples. Low and high cooccurrence are shown in blue and red, respectively. Intensity of the color reflects the odds ratio. Statistically significant association as determined by q value is marked by asterisks. (C) Number of samples with cooccurrence of the indicated genetic events in the cohort of 134 MCL samples. Significance of Fisher’s exact test indicated by q.

