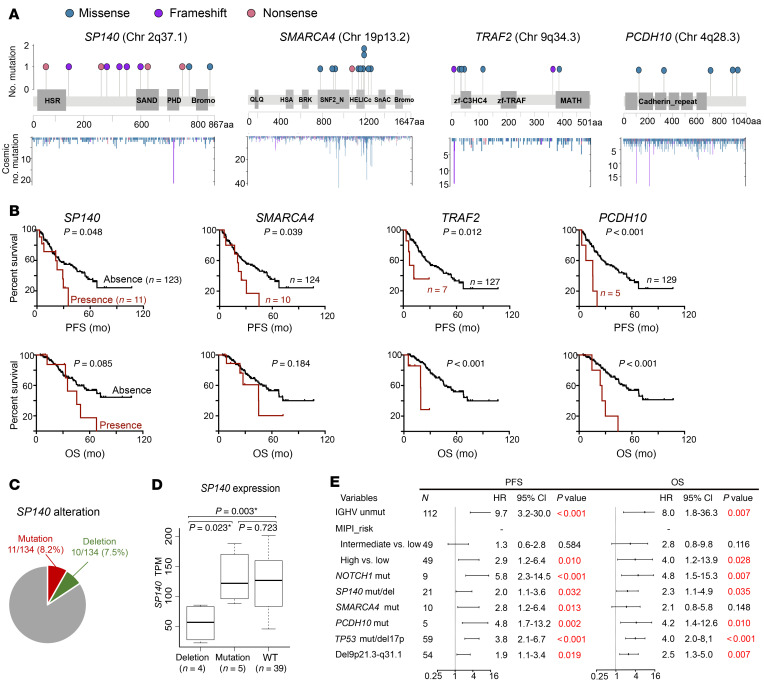
Figure 3. Associations of somatic mutations with clinical outcomes.
(A) Lollipop diagrams of selected putative driver genes showing mutation subtype, position, and frequency. Bottom: y axis indicates the number of identified mutations in the COSMIC database. (B) Kaplan-Meier plots (with log-rank P values) of PFS and OS associated with presence and absence of selected mutations. (C) Samples with SP140 mutations or deletions did not overlap in the cohort. (D) Deletion of SP140 affected its gene expression. SP140 expression TPM value was extracted and plotted from MCL samples with SP140 deletion, mutation, or WT. *P < 0.05. (E) Forest plots of the multivariate analysis of MIPI risk groups and individual genetic factors for PFS and OS in our MCL cohort.

