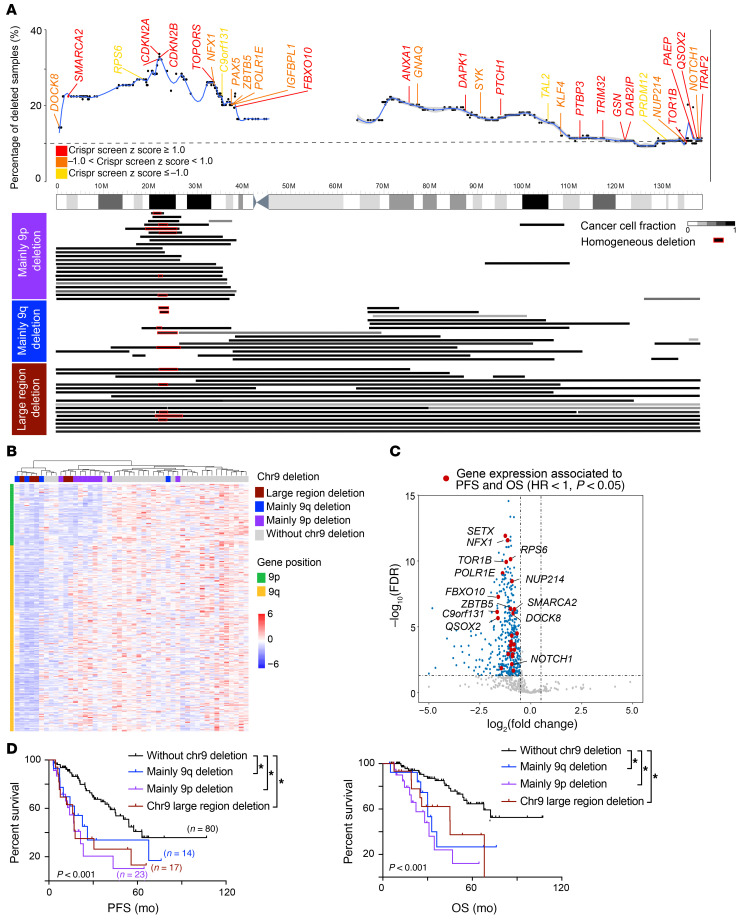
Figure 4. Deletion of chromosome 9 was associated with poor survival.
(A) Chromosome 9 deletion in samples from our cohort. Top: blue line indicates percentage of MCL samples with chromosome 9 deletion at the location. Known tumor suppressors and oncogenes present on chromosome 9 are color coded based on their z score in the CRISPR/Cas9 screen in JeKo-1 cells. Bottom: deletions in 9p (purple), 9q (blue), or large regions (dark red) in samples from our cohort. Homozygous minimal 9p deletions are marked in red. CCF (Supplemental Methods) of chromosome 9 deletion is shown in gray scale. (B) Unsupervised clustering analysis of gene expression in chromosome 9 distinguishes MCL samples with deletions in different region. (C) Volcano plot of genes on chromosome 9 that are differentially expressed between MCL samples that have and do not have chromosome 9 deletions. Downregulated genes that were significantly associated with shorter PFS and OS are indicated in red (Cox’s regression HR <1, P < 0.05). (D) Kaplan-Meier plots of PFS and OS according to type of chromosome 9 deletion.

