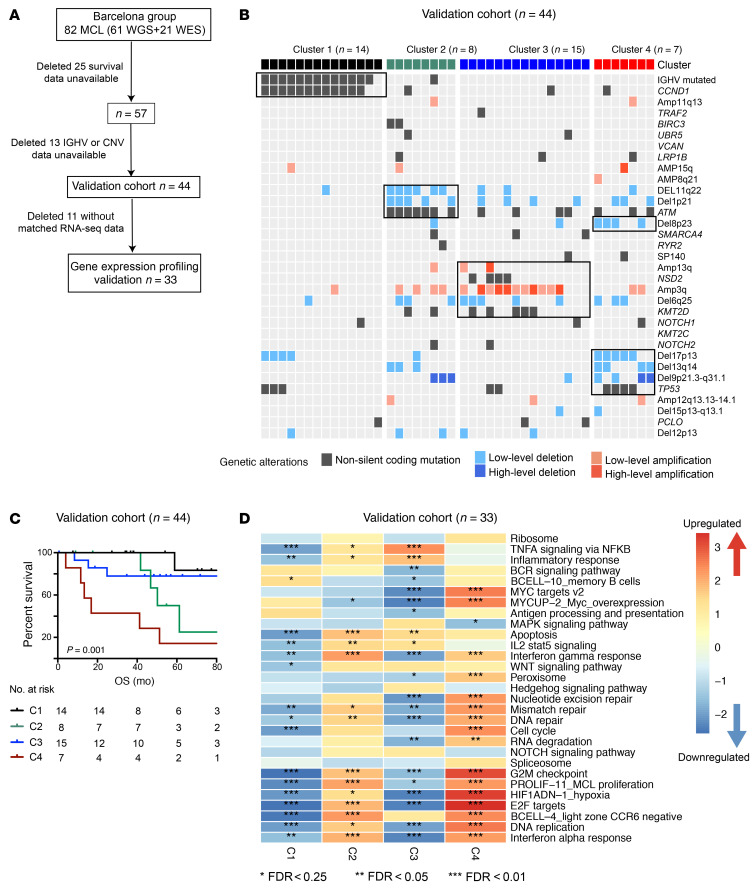
Figure 6. Molecular cluster and gene expression signature validated in Barcelona cohort.
(A) Sample inclusion description in the validation cohort. (B) Projective nonnegative matrix factorization consensus clustering was performed using genetic alterations identified from our discovery cohort (Figure 5A). Clusters 1–4 are shown with their associated landmark genetic alterations (boxed for each cluster). Header shows cluster association (C1, black; C2, green; C3, blue; C4, red). (C) Kaplan-Meier plots of OS of patients grouped into the 4 clusters. P indicates log-rank test. Number indicates samples included in each cluster. (D) Integration of genetic and transcriptomic analyses identified gene expression signatures for each genetic subset. The heatmap was generated using normalized enrichment score (NES). Asterisks indicate the significance level of the enrichment.

