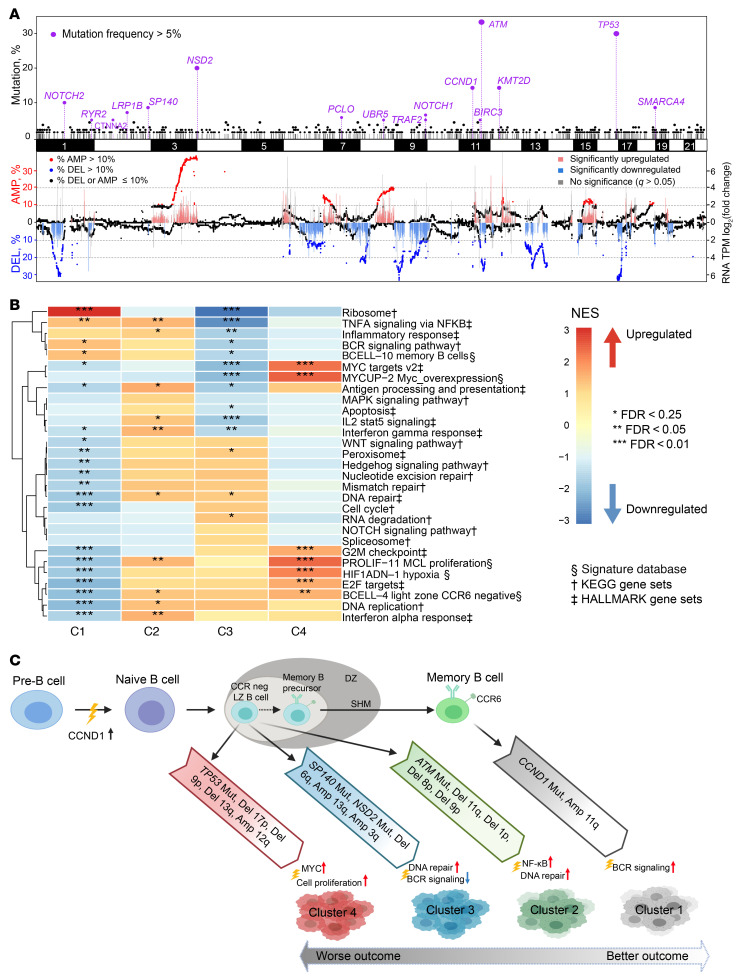
Figure 7. Integrative analysis of genome and transcriptome reveals a unique gene expression signature in each cluster.
(A) Recurrent somatic mutations, SCNAs, and gene expression associated with SCNAs. Top panel: x axis shows the chromosome location of recurrent somatic mutations; y axis indicates the frequency of mutations detected in our MCL cohort (n = 134). Genes shown in purple have a mutation incidence of greater than 5%. Bottom panel: left y axis indicates proportions of CN deletion (DEL) and amplification (AMP). Each dot represents a gene at its chromosome location. Genes with absolute CN < 1.7 or > 2.3 were defined as deleted or amplified, respectively. Genes with a deletion incidence > 10% are shown in blue, and genes with an amplification incidence > 10% as red. (B) Integration of genetic and transcriptomic analyses identified unique gene expression signatures for each genetic subset. The Hallmark and KEGG gene sets and Signature database were used for Gene Set Enrichment Analysis. The heatmap was generated using normalized enrichment score (NES). Red indicates an upregulated pathway in the cluster compared with other clusters, while blue indicates a downregulated pathway. Asterisks indicate the significance level of the enrichment. (C) Proposed model for the 4 MCL subgroups. Clusters 1–4 were all associated with distinct genetic events and gene expression signatures. C1 had indolent disease and carried memory B cell gene signature. C2–C4 had more aggressive clinical courses and expressed CCR6-negative light zone or naive B cell gene signature.

