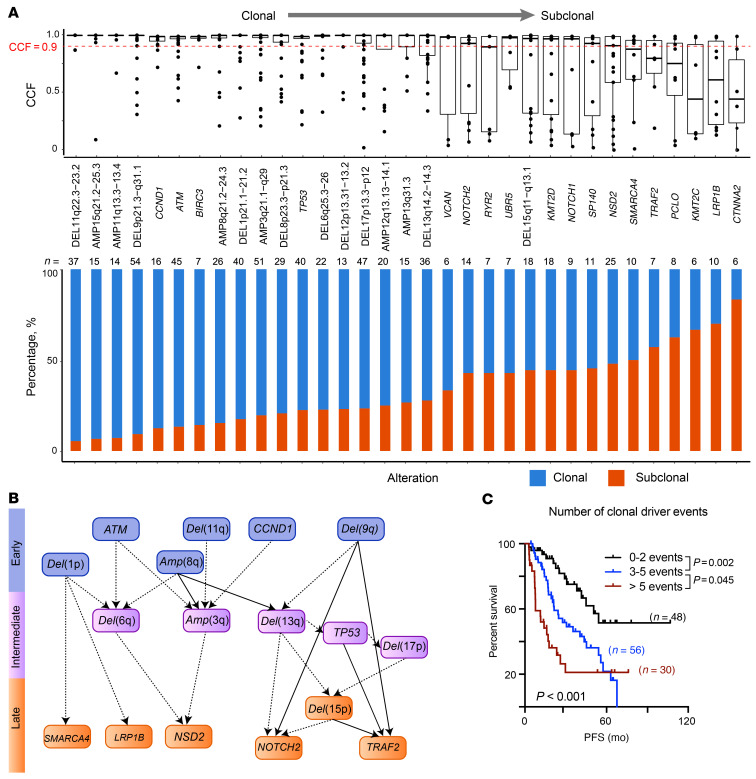
Figure 8. Clonal driver events associated with clinical outcomes.
(A) CCF values for each sample affected by a recurrent genetic alteration across all 134 samples. Median CCF values are shown (top, bars represent the median and interquartile range for each genetic alteration). Alterations with a CCF value of greater than 0.9 were defined as a clonal event. The cumulative proportion of a recurrent genetic alteration found as clonal (blue) or subclonal (red) in the cohort is shown in bottom plot. (B) Computational inference of temporal order of genetic alterations in MCL. Arrows indicate when paired clonal and subclonal genetic alterations were found in the same sample. Dashed lines indicate the temporal order was found in 3 or more samples; solid lines that the temporal order was found in 5 or more samples. (C) Kaplan-Meier plot of PFS according to the number of clonal driver events.

