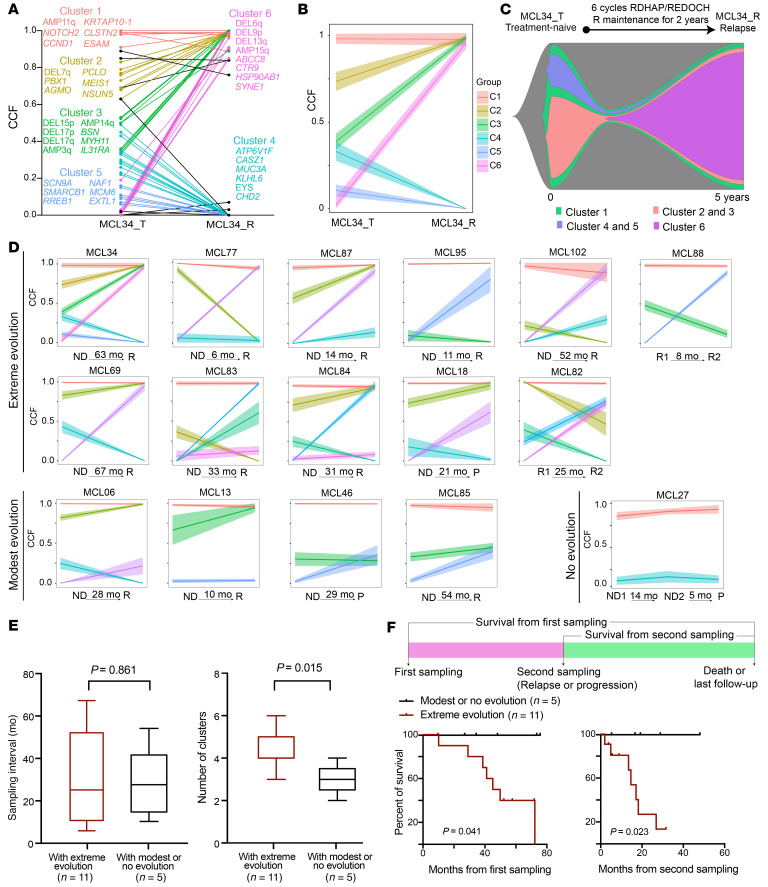
Figure 9. Clonal evolution pattern in MCL and its association with clinical outcome.
(A–C) Depiction of tumor clonal evolution from diagnosis to relapse in a representative patient (MCL34). (A) Dynamic changes in genetic alterations during disease progression. Representative genetic alterations for each cluster are listed in the plot. (B) Clonal evolution estimated using PhylogicNDT. The mean CCF and 95% CI of each cluster are indicated. (C) Fish plot showing the clonal evolution process. The width of each time point indicates the clonal fractions of each subclone population. (D) Joint distributions of CCF values of genetic alterations across 2 (or more) time points (ND, newly diagnosed; P, progression; R, relapse; R1, first relapse; R2, second relapse) were estimated using clustering analysis. Each line corresponds to cluster of genetic alterations (range 3–33) and illustrates the dynamic changes in CCF at the different time points for clusters. We classified any CCF increase or decrease greater than 0.5 between 2 time points for any cluster as extreme evolution. CCF changes between 0.2 and 0.5 or less than 0.2 were classified as moderate evolution or no evolution, respectively. (E) Sample interval and number of clonal clusters in patients with either extreme evolution or with modest or no evolution. (F) Kaplan-Meier plot of survival from either first sampling (left) or second sampling (right).

