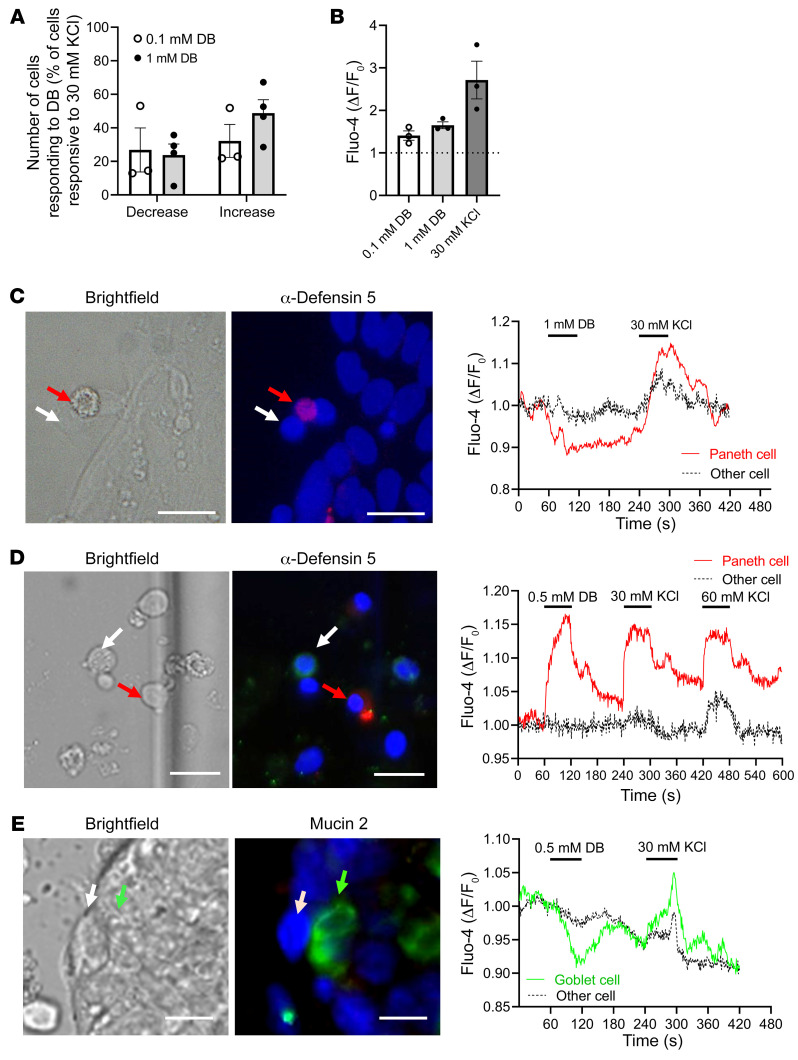
Figure 2. Intracellular Ca2+ changes in response to DB and immunostaining identification of cells in primary crypts from patients with obesity.
(A) Percentage of 30 mM KCl-responsive primary jejunal cells from patients with obesity that responded to 0.1 mM or 1 mM DB administration with either a decrease or increase in intracellular Ca2+ levels. (B) Relative rise in fluorescence intensity in single cells from crypts of individuals with obesity treated with DB or KCl. Data represent the mean ± SEM. n = 3–4 subjects. (C–E) Images show the cells in bright-field, as well as immunofluorescence staining for α-defensin 5 (red) and mucin 2 (green). Nuclei were stained with DAPI (blue). Ca2+ changes in the regions of interest from the images in C–E are shown in the tracings. (C) Tracing of a Paneth cell responding to 1 mM DB with a Ca2+ rise and another unidentified, nonresponding cell. (D) Tracing of a Paneth cell responding to 0.5 mM DB with a Ca2+ increase and another unidentified, nonresponding cell. (E) Tracing of a goblet cell responding to 0.5 mM DB with a Ca2+ decrease and an unidentified, nonresponding cell. Scale bars: 20 μM.

