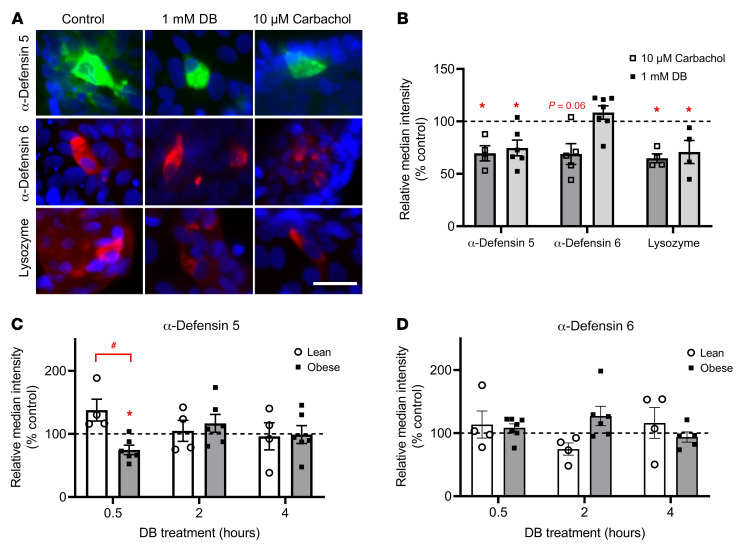
Figure 3. Quantitative analysis of the time-dependent effects of DB on protein expression in Paneth cells from lean and obese individuals.
(A) Representative immunofluorescence staining for α-defensin 5, α-defensin 6, and lysozyme after a 30-minute treatment with DMEM, 1 mM DB, or 10 μM carbachol in jejunal crypts from a patient with obesity. Scale bar: 25 μm. (B) Quantification of immunostainings for α-defensin 5, α-defensin 6, and lysozyme after a 30-minute treatment of crypts from obese individuals with 1 mM DB or 10 μM carbachol, expressed relative to the control (DMEM) (n = 4–7). (C and D) Time-dependent effect (0.5–4 hours) of 1 mM DB treatment on the relative intensity of the immunostainings for α-defensin 5 and α-defensin 6 in jejunal crypts from lean and obese individuals (n = 4–7). Data represent the mean ± SEM, and single values are plotted. Statistical significance was determined using a mixed model with patient as the random effect. *P < 0.05, treatment versus control; #P < 0.05, lean patients versus patients with obesity.

