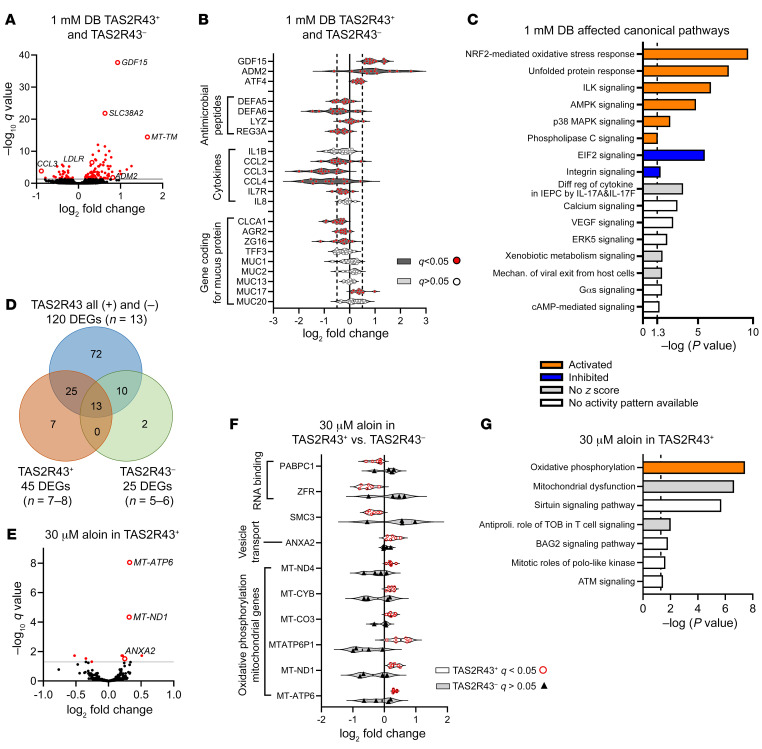
Figure 7. Transcriptomics analysis of jejunal crypts from patients with obesity stimulated with DB or aloin.
Significantly DEGs revealed by transcriptomics analysis of human primary jejunal crypts from patients with obesity (n = 5–13) after 4 hours of treatment with the bitter compounds DB or aloin. (A) Volcano plot showing the log2 FCs of the detected genes after treatment of crypts with 1 mM DB versus DMEM (n = 13). Significantly DEGs are indicated in red. (B) Selected DEGs of Paneth cell markers (antimicrobial peptides), cytokines, and goblet cell markers (mucus proteins) after treatment with 1 mM DB. (C) Canonical pathways affected by 1 mM DB treatment, identified by analyzing the RNA-Seq data with IPA. Diff reg, differential regulation; Mechan., mechanism. (D) Venn Diagram comparing the amount of significantly DEGs identified in the data sets that included either all TAS2R43+ and TAS2R43– or only TAS2R43+ or only TAS2R43– genotypes. (E) Volcano plot showing the log2 FCs of the detected genes after treatment of crypts with 30 μM aloin or DMEM (n = 6–8). Significantly DEGs are indicated in red. (F) DEGs after treatment with 30 μM aloin in crypts from TAS2R43+ (n = 6) compared with TAS2R43– (n = 4) patients with obesity. (G) IPA identification of the canonical pathways that were affected in jejunal crypts after treatment with 30 μM aloin. Antiproli., antiproliferative.

