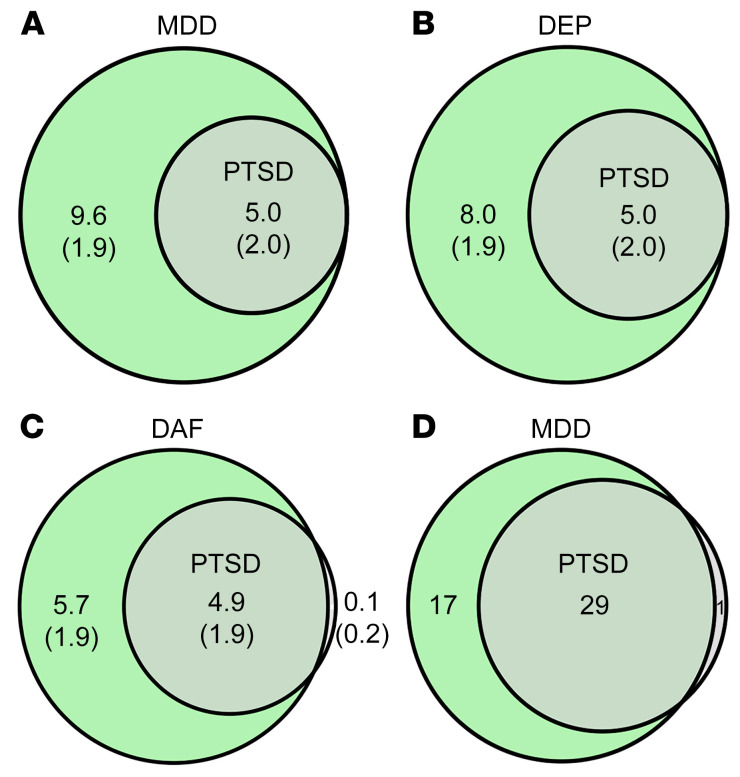
Figure 1. Shared causal variants and genomic loci between the depressive phenotypes and posttraumatic stress disorder (PTSD).
(A–C) Venn diagrams of unique and shared causal variants, showing polygenic overlap between PTSD and the depressive phenotypes. The numbers indicate the estimated quantity of causal variants (in thousands) per component, explaining 90% of SNP-attributed heritability for each phenotype. The numbers within parentheses indicate SEM. DEP, depression; DAF, depressed affect. (D) Venn diagram of genomic loci that overlap between major depressive disorder (MDD) and PTSD. The numbers indicate amounts of genomic loci either unique for each condition or shared between MDD and PTSD.

