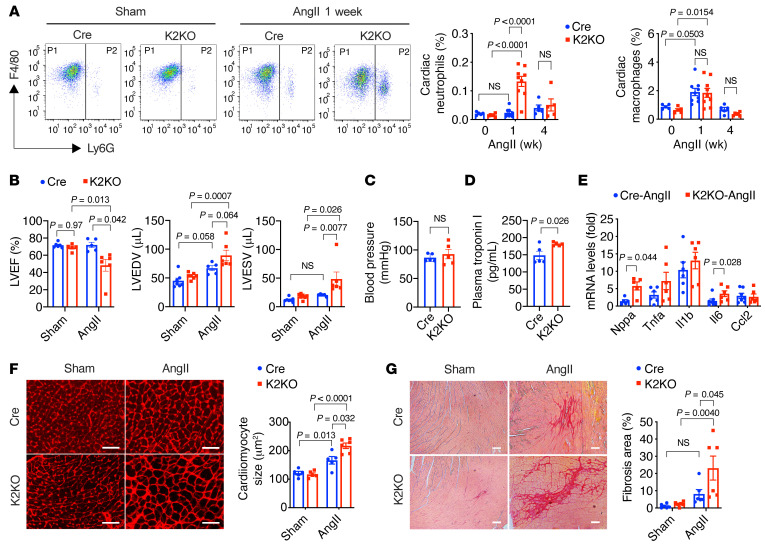
Figure 2. Myeloid KLF2 deficiency enhances AngII-induced cardiac hypertrophy.
(A) FACS analysis of myeloid cells in the myocardium (n = 5–9). P1, CD45+CD11b+F4/80+Ly6G– macrophages; P2, CD45+CD11b+Ly6G+ neutrophils. (B) Echocardiography assessments of mouse left ventricular (LV) functions after 4-week infusion (n = 5–6). LVEF, left ventricular ejection fraction; LVEDV, LV volume at end of diastole; LVESV, LV volume at end of systole. (C) Mean blood pressure measured from the right common carotid artery by invasive hemodynamics (n = 5). (D) Plasma levels of cardiac troponin (cTnT) after 1 week of AngII infusion (n = 5). (E) Expression of hypertrophy and inflammation genes in the heart (n = 6–7). (F) Cardiomyocyte cross-sectional area analysis by Alexa Fluor 594–conjugated wheat germ agglutinin (WGA) staining (n = 5–6). (G) Myocardial fibrosis analysis by Picrosirius red staining (n = 6). P values are from 2-way ANOVA with Tukey’s post hoc test (A, B, F, and G) or 2-tailed, unpaired Student’s t test (C–E). NS, not significant (P > 0.5). Scale bars: 25 μm.

