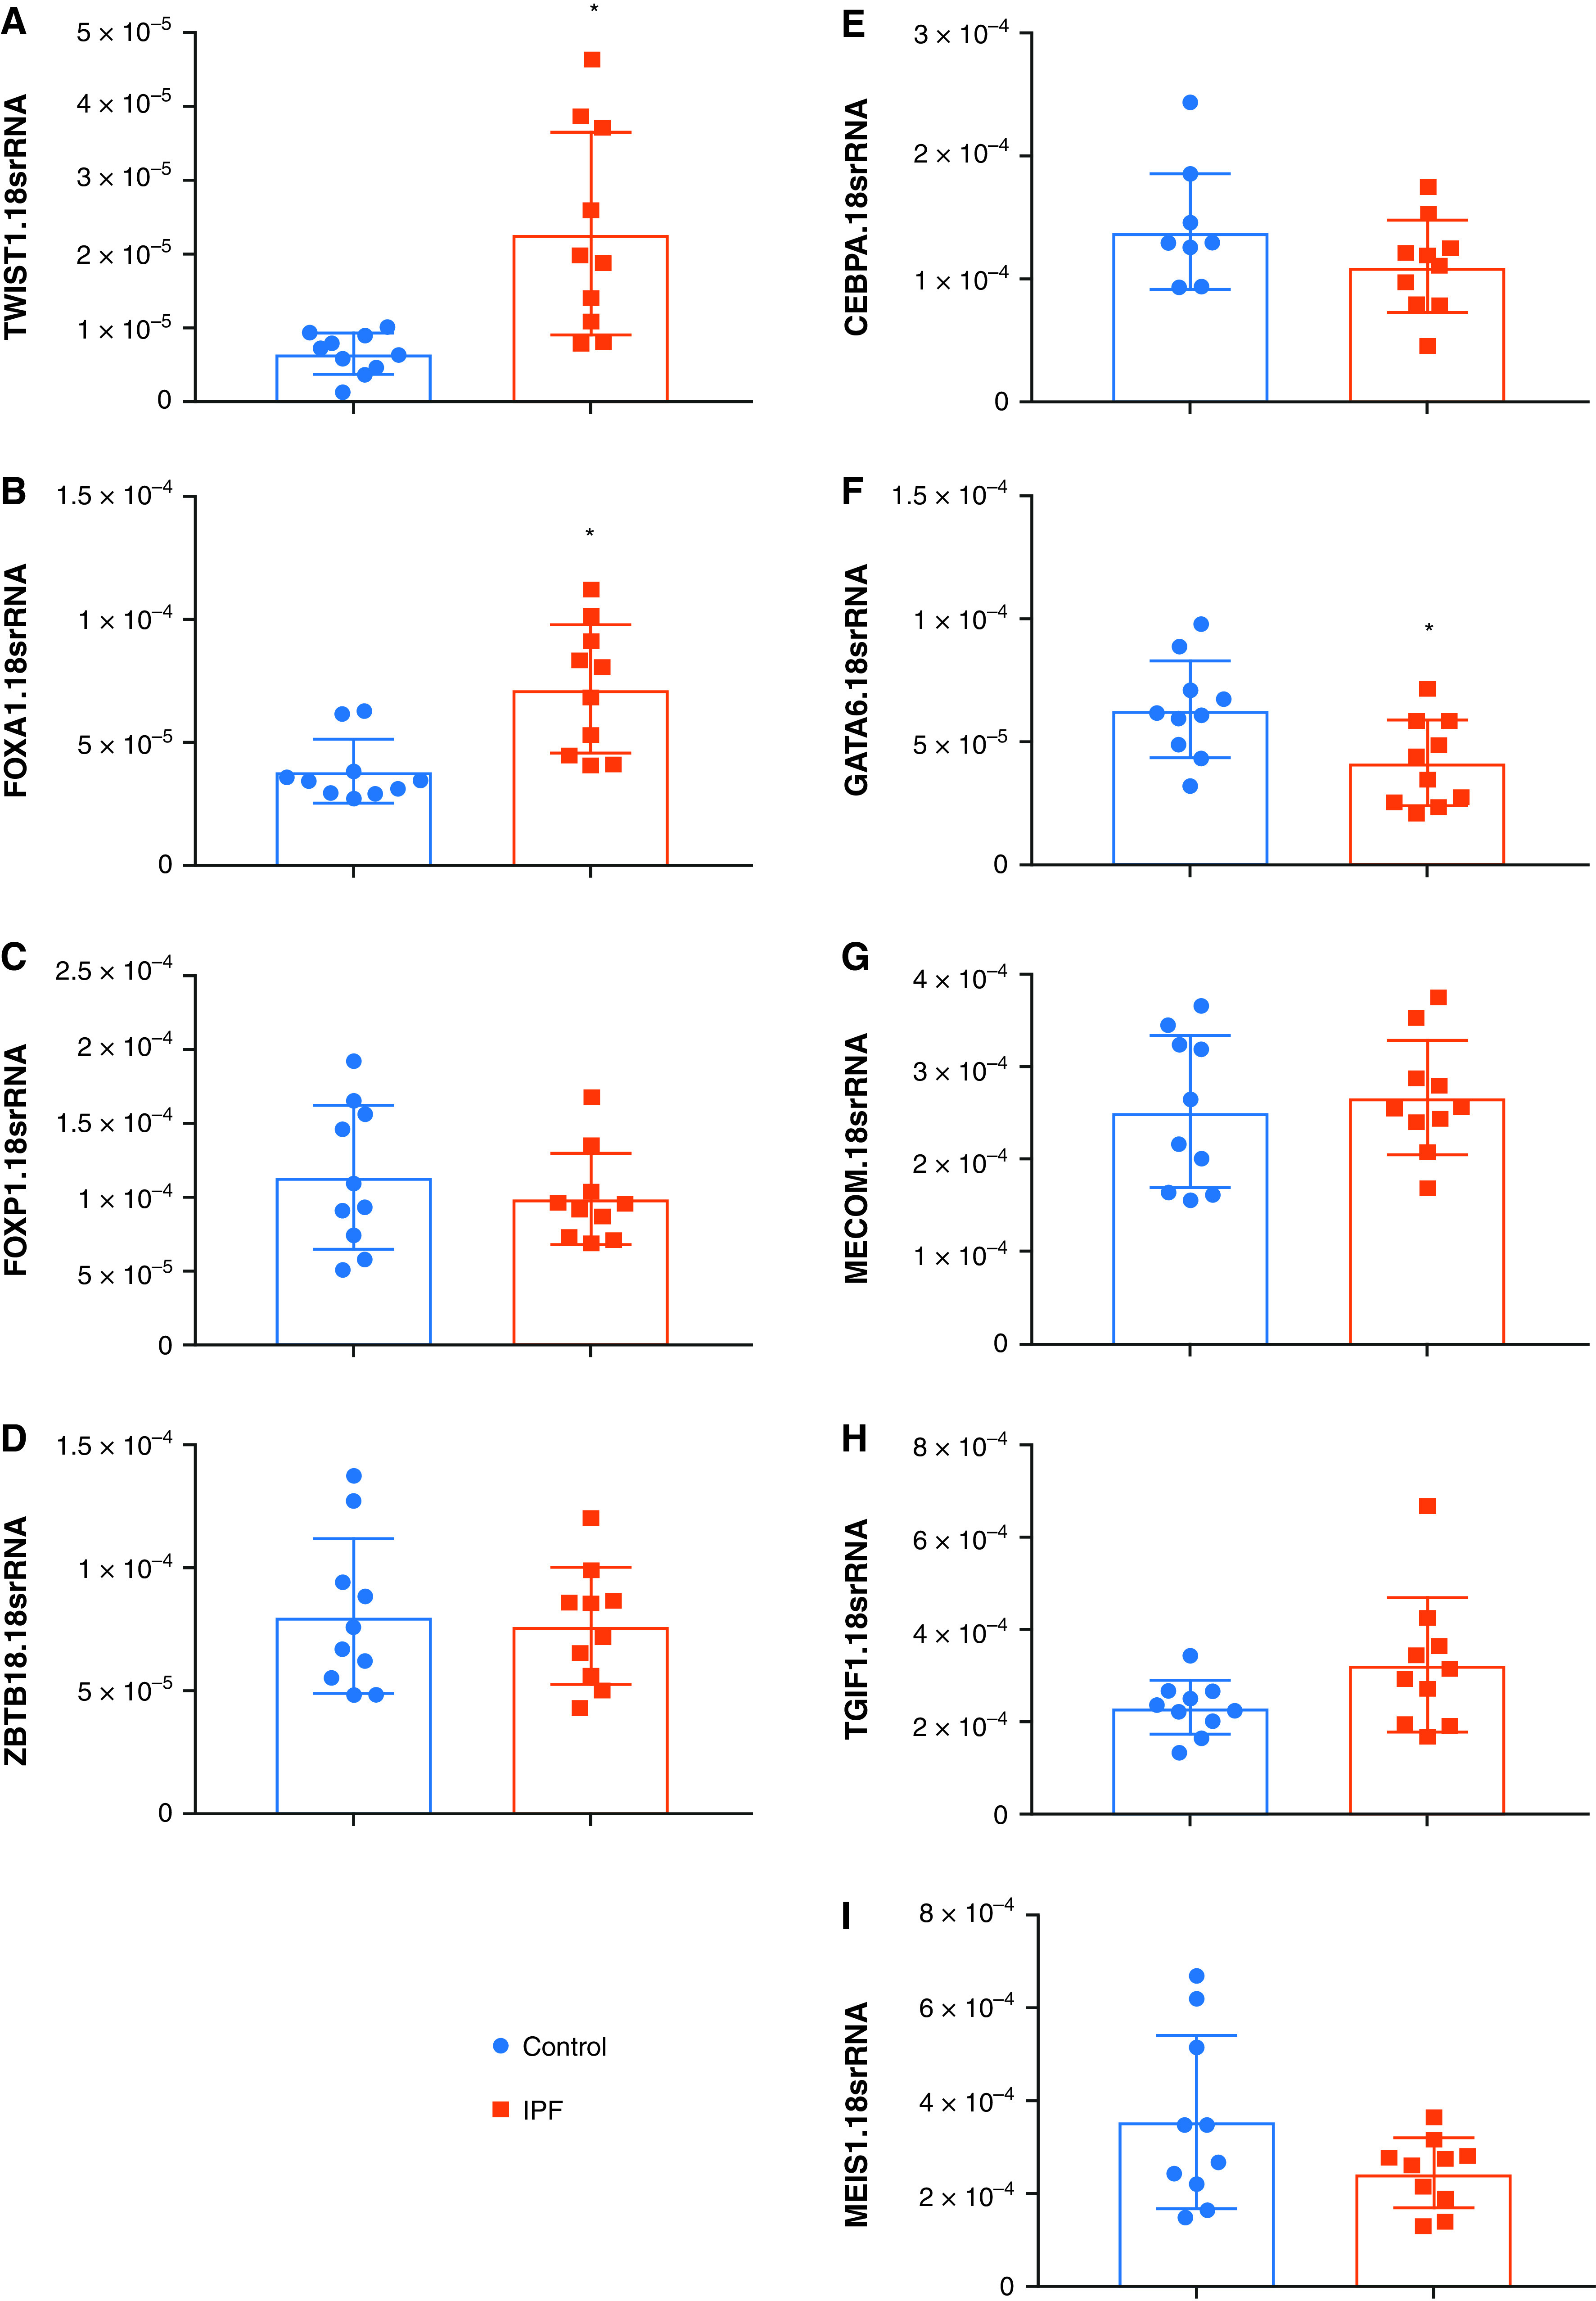
Figure 4.

(A–I) Expression levels for the TFs: TWIST1 (A), FOXA1 (B), FOXP1 (C), ZBTB18 (D), CEBPA (E), GATA6 (F), MECOM (G), TGIF (H) and MEIS1 (I) from control or IPF lung tissue. Significance level *P < 0.05 refers to comparisons between Control and IPF.
