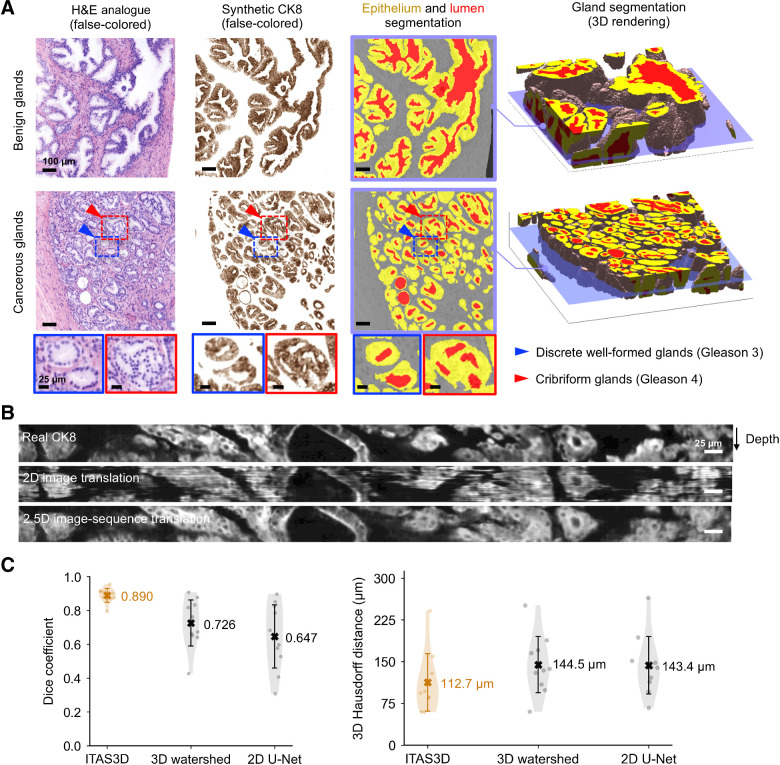
Figure 3.
Segmentation results with ITAS3D. A, 2D cross-sections are shown (from left to right) of false-colored H&E analogue images, synthetic-CK8 IHC images generated by image-sequence translation, and gland-segmentation masks based on the synthetic-CK8 images (yellow, epithelium; red, lumen; gray, stroma). The example images are from large 3D datasets containing benign glands (first row) and cancerous glands (second row). Zoom-in views show small discrete well-formed glands (Gleason pattern 3, blue box) and cribriform glands (Gleason pattern 4, red box) in the cancerous region. Three-dimensional renderings of gland segmentations for a benign and cancerous region are shown on the far right. Scale bar, 100 μm. B, Side views of the image sequences (with the depth direction oriented down) of real- and synthetic-CK8 immunofluorescence images. The 2.5D image translation results exhibit substantially improved depth-wise continuity compared with the 2D image translation results. Scale bar, 25 μm. C, For quantitative benchmarking, Dice coefficients (larger is better) and 3D Hausdorff distances (smaller is better) are plotted for ITAS3D-based gland segmentations along with two benchmark methods (3D watershed and 2D U-net), as calculated from 10 randomly selected test regions. Violin plots are shown with mean values denoted by a center cross and SDs denoted by error bars. For the 3D Hausdorff distance, the vertical axis denotes physical distance (in microns) within the tissue.

