. 2021 Dec 1;82(2):334–345. doi: 10.1158/0008-5472.CAN-21-2843

Figure 4.

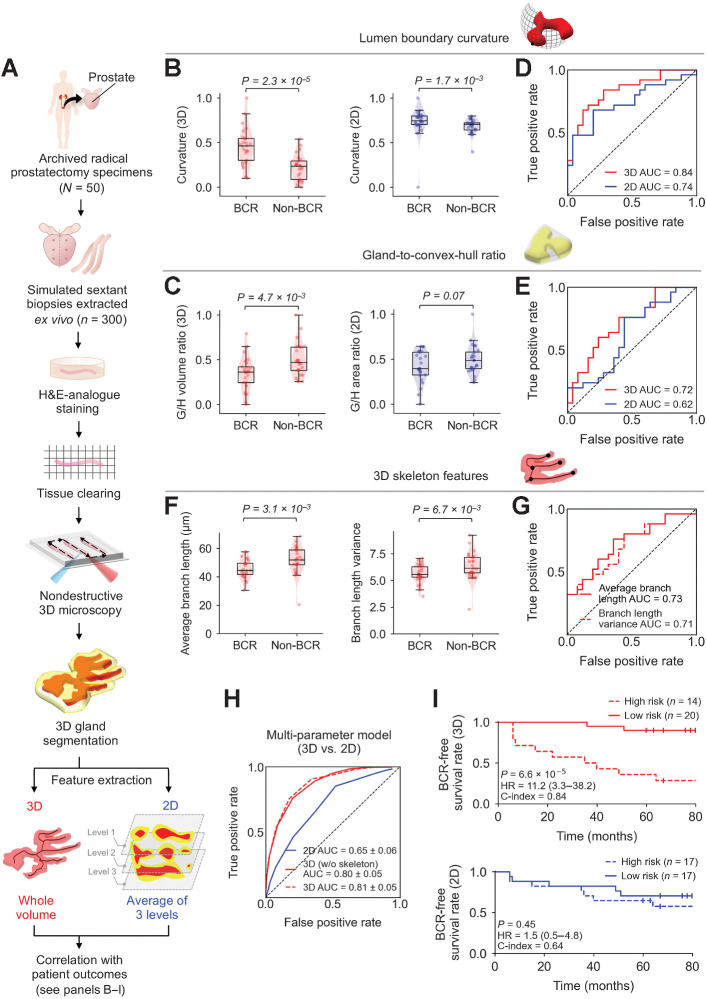
Figure 4. Clinical study comparing the performance of 3D versus 2D glandular features for risk stratification. A, Archived (FFPE) RP specimens were obtained from a well-curated cohort of 50 patients, from which, 300 simulated (ex vivo) needle biopsies were extracted (6 biopsies per case, per sextant-biopsy protocol). The biopsies were labeled with a fluorescent analogue of H&E staining, optically cleared to render the tissues transparent to light, and then comprehensively imaged in 3D with OTLS microscopy. Prostate glands were computationally segmented from the resultant 3D biopsy images using the ITAS3D pipeline. Three-dimensional glandular features were extracted from tissue volumes containing prostate cancer. Two-dimensional glandular features were extracted from three levels per volume and averaged. B and C, Violin and box plots are shown for two examples of 3D glandular features, along with analogous 2D features, for cases in which BCR was observed within 5 years of RP (“BCR”) and for cases with no BCR within 5 years of RP (“non-BCR”). For both sets of example features, “lumen boundary curvature” in B and “gland-to-convex hull ratio” (G/H) in C, the 3D version of the feature shows improved stratification between BCR and non-BCR groups. D and E, ROC curves also show improved risk stratification with the 3D features versus corresponding 2D features, with considerably higher AUC values. F, Violin and box plots are shown of representative gland-skeleton features (average branch length and branch length variance), which can only be accurately derived from the 3D pathology datasets, showing significant stratification between BCR and non-BCR groups. G, ROC curves are shown, along with AUC values, for average branch length and branch length variance. H, ROC curves are shown of various multiparameter models, including those trained with 2D glandular features, 3D glandular features excluding skeleton features, and 3D glandular features including skeleton features. I, KM curves are shown for BCR-free survival, showing that a multiparameter model based on 3D glandular features is better able to stratify patients into low-risk and high-risk groups with significantly different recurrence trajectories (P = 6.6 × 10⁻⁵, HR = 11.2, C-index = 0.84).

Clinical study comparing the performance of 3D versus 2D glandular features for risk stratification. A, Archived (FFPE) RP specimens were obtained from a well-curated cohort of 50 patients, from which, 300 simulated (ex vivo) needle biopsies were extracted (6 biopsies per case, per sextant-biopsy protocol). The biopsies were labeled with a fluorescent analogue of H&E staining, optically cleared to render the tissues transparent to light, and then comprehensively imaged in 3D with OTLS microscopy. Prostate glands were computationally segmented from the resultant 3D biopsy images using the ITAS3D pipeline. Three-dimensional glandular features were extracted from tissue volumes containing prostate cancer. Two-dimensional glandular features were extracted from three levels per volume and averaged. B and C, Violin and box plots are shown for two examples of 3D glandular features, along with analogous 2D features, for cases in which BCR was observed within 5 years of RP (“BCR”) and for cases with no BCR within 5 years of RP (“non-BCR”). For both sets of example features, “lumen boundary curvature” in B and “gland-to-convex hull ratio” (G/H) in C, the 3D version of the feature shows improved stratification between BCR and non-BCR groups. D and E, ROC curves also show improved risk stratification with the 3D features versus corresponding 2D features, with considerably higher AUC values. F, Violin and box plots are shown of representative gland-skeleton features (average branch length and branch length variance), which can only be accurately derived from the 3D pathology datasets, showing significant stratification between BCR and non-BCR groups. G, ROC curves are shown, along with AUC values, for average branch length and branch length variance. H, ROC curves are shown of various multiparameter models, including those trained with 2D glandular features, 3D glandular features excluding skeleton features, and 3D glandular features including skeleton features. I, KM curves are shown for BCR-free survival, showing that a multiparameter model based on 3D glandular features is better able to stratify patients into low-risk and high-risk groups with significantly different recurrence trajectories (P = 6.6 × 10⁻⁵, HR = 11.2, C-index = 0.84).