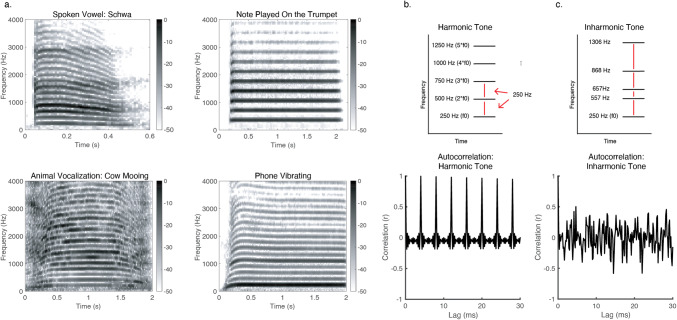
Fig. 1.
Harmonicity. a Spectrograms of example natural harmonic sounds: a spoken vowel, a cow mooing, a note played on a trumpet, and a phone vibrating. The frequency components of such sounds are multiples of a fundamental frequency, and are thus regularly spaced across the spectrum. b Schematic spectrogram of a harmonic tone with an f0 of 250 Hz, along with its autocorrelation. The autocorrelation has a peak at the lag equal to the period of the f0 (and at multiples of this lag). c Schematic spectrogram of an inharmonic tone along with an example autocorrelation. In this example, the inharmonic tone was generated by jittering the frequencies of a 250 Hz harmonic tone. Jittering was accomplished by sampling a jitter value from the distribution U(-0.5, 0.5), multiplying by the f0, then adding the resulting value to the frequency of the respective harmonic, constraining adjacent components to be separated by at least 30 Hz (via rejection sampling) in order to avoid salient beating. All harmonics above the fundamental were jittered in this way. The autocorrelation functions of inharmonic tones do not exhibit strong peaks, indicating that they lack a fundamental frequency in the range of audible pitch

