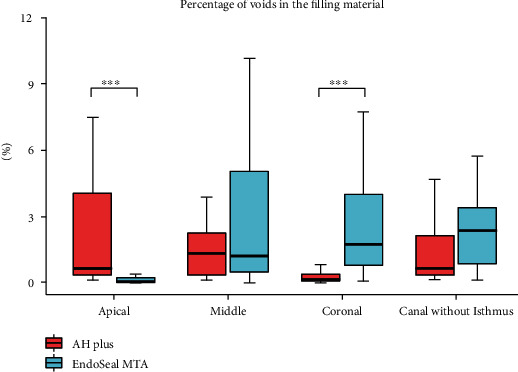
Figure 4.

Distribution of percentage of voids in the filling material in canals without an isthmus between the AH Plus group and the EndoSeal MTA group. Data are presented as median (interquartile range). p values were computed using the Mann–Whitney U test. ∗p < 0.05, ∗∗p < 0.01, ∗∗∗p < 0.001.
