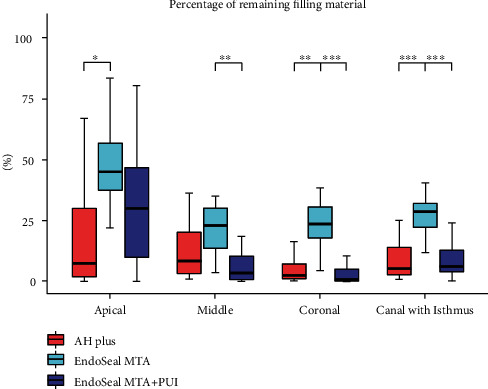
Figure 5.

Distribution of the remaining ratio in canals with an isthmus among the AH Plus, EndoSeal MTA, and EndoSeal MTA + PUI groups. Data are presented as median (interquartile range). p values were adjusted using the Bonferroni post hoc method. ∗p < 0.05, ∗∗p < 0.01, ∗∗∗p < 0.001.
