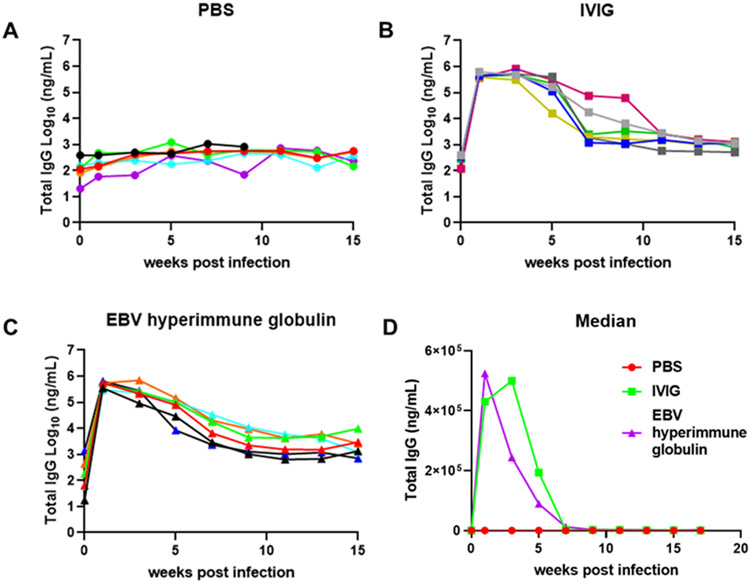
Fig. 5. Quantification of total human IgG in mouse plasma.
The total human IgG concentration was measured by ELISA in the plasma of mice that received PBS (A), IVIG (B), or EBV hyperimmune globulin (C). Each line represents one mouse and plasma samples collected bi-weekly were used in the assay. Median total IgG level of each group at different time points was calculated (D).

