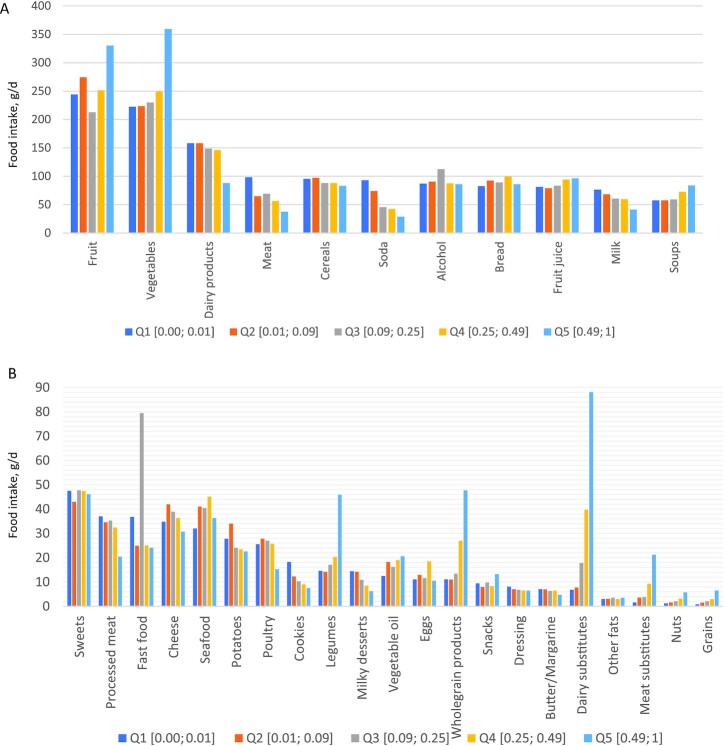
FIGURE 4.
Food consumption (g/d) according to the level of organic food consumption (weighted data; N = 28,245). Values are means of consumption (g/d) across quintiles of the share of organic food in the diet (defined as the total weight without water). For clarity, food groups are split into panels A and B. Abbreviation: Q, quintile.

