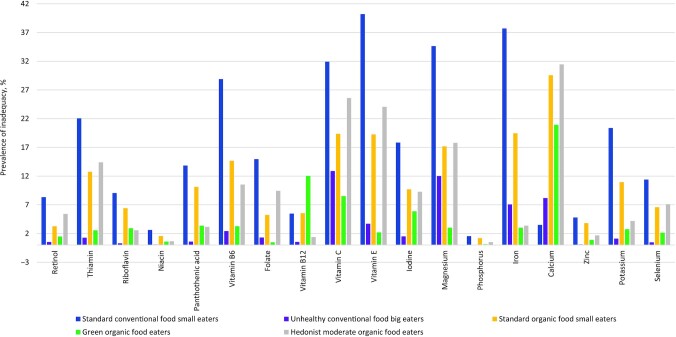
FIGURE 5.
Prevalence of nutritional inadequacy among the 5 clusters (N = 28,245). Values are the prevalence (%) of nutritional inadequacy for micronutrients across clusters, estimated by the proportion of participants with intake below the estimated average requirement for the French population. The 5 clusters are derived from a principal component analysis based on the consumption of 16 organic and 16 conventional food groups, followed by a hierarchical clustering.

