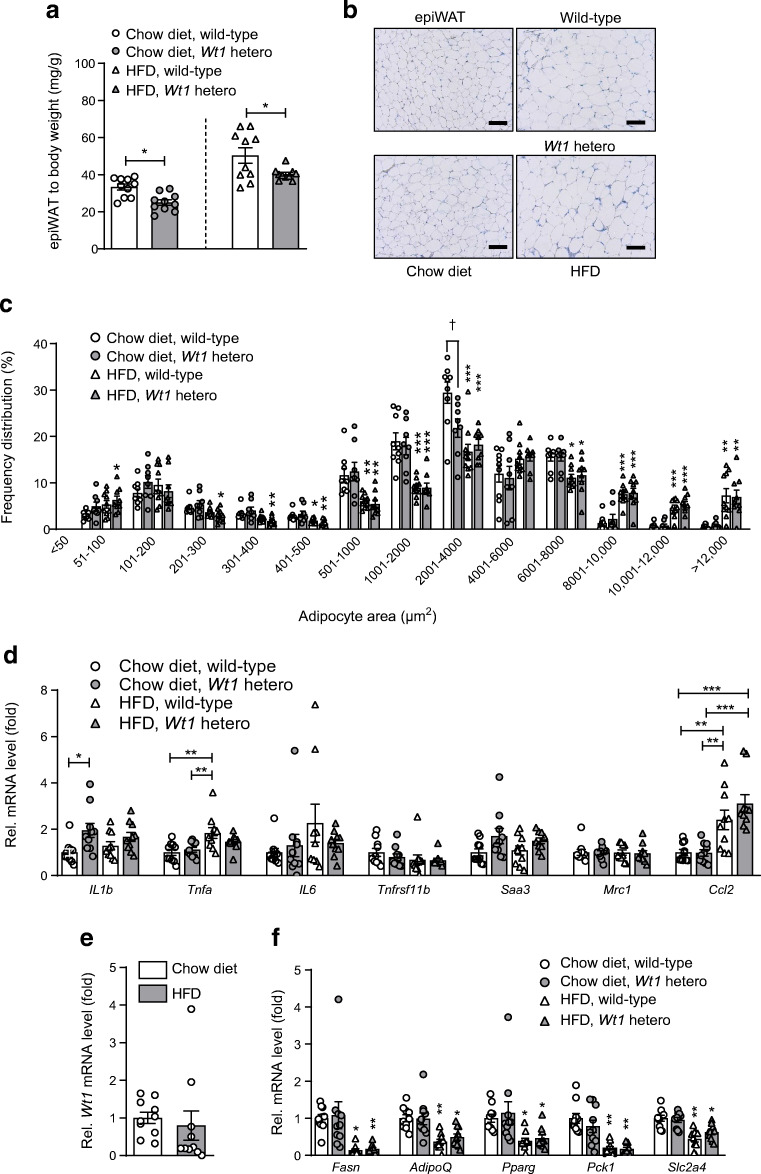
Fig. 3.
Heterozygous Wt1 knockout mice fed with HFD have lower epididymal WAT to body weight ratios. Wild-type and heterozygous Wt1 knockout mice (n = 40 total) were kept on either chow diet (10% of kJ from fat) or HFD (60% of kJ from fat) for 11 weeks. (a) Epididymal WAT (epiWAT) weight to body weight ratios. Bars indicate means ± SEM, n = 10, each. *p < 0.05 between wild-type and Wt1 mutant animals (Student’s t test). Note that, for better data visualisation, statistical significance between mice receiving chow diet and HFD is not indicated. (b) Representative H&E staining of epiWAT of a wild-type and heterozygous Wt1 knockout mouse fed with either chow or HFD. Scale bars, 100 μm. (c) Frequency distribution of adipocyte areas in epididymal WAT of wild-type and heterozygous Wt1 knockout mice receiving either chow diet or HFD. Measurements were performed with tissue sections from n = 40 animals analysing more than 2500 cells per group. Statistical differences between mice of identical genotype receiving HFD vs chow diet are indicated by asterisks (*p < 0.05, **p < 0.01, ***p < 0.001, ANOVA with Tukey post hoc test). †p < 0.05, statistical differences between wild-type and heterozygous Wt1 knockout mice (ANOVA with Tukey post hoc test). Note that the adipocyte areas were not significantly different between wild-type and heterozygous Wt1 knockout mice except for the size range 2001–4000 μm2. In this particular range, Wt1 knockout mice fed with chow diet had significantly smaller adipocytes in their epididymal WAT than wild-type mice. (d) Relative mRNA levels of inflammation-related genes in epididymal WAT of normal and Wt1 mutant mice. Bars represent means ± SEM, n = 10 in each group. *p < 0.05, **p < 0.01 and ***p < 0.001 as shown, ANOVA with Tukey post hoc test. (e) Relative Wt1 mRNA levels in epididymal WAT of wild-type mice receiving either chow diet or HFD. Transcripts were measured by RT-qPCR and normalised to Actb mRNA. Bars indicate means ± SEM, n = 10. (f) Relative transcript levels of genes involved in fatty acid and glucose homeostasis in epididymal WAT of wild-type and heterozygous Wt1 knockout mice receiving either normal diet or HFD. Bars show means ± SEM, n = 10 in each group. *p < 0.05 and **p < 0.01 between mice of the same genotype receiving HFD vs chow diet, ANOVA with Tukey post hoc test

